

Question: Please help me with these. I cant understand these problems Example 33 The following set of raw data shows the lengths, in millimeters, measured to
Please help me with these. I cant understand these problems
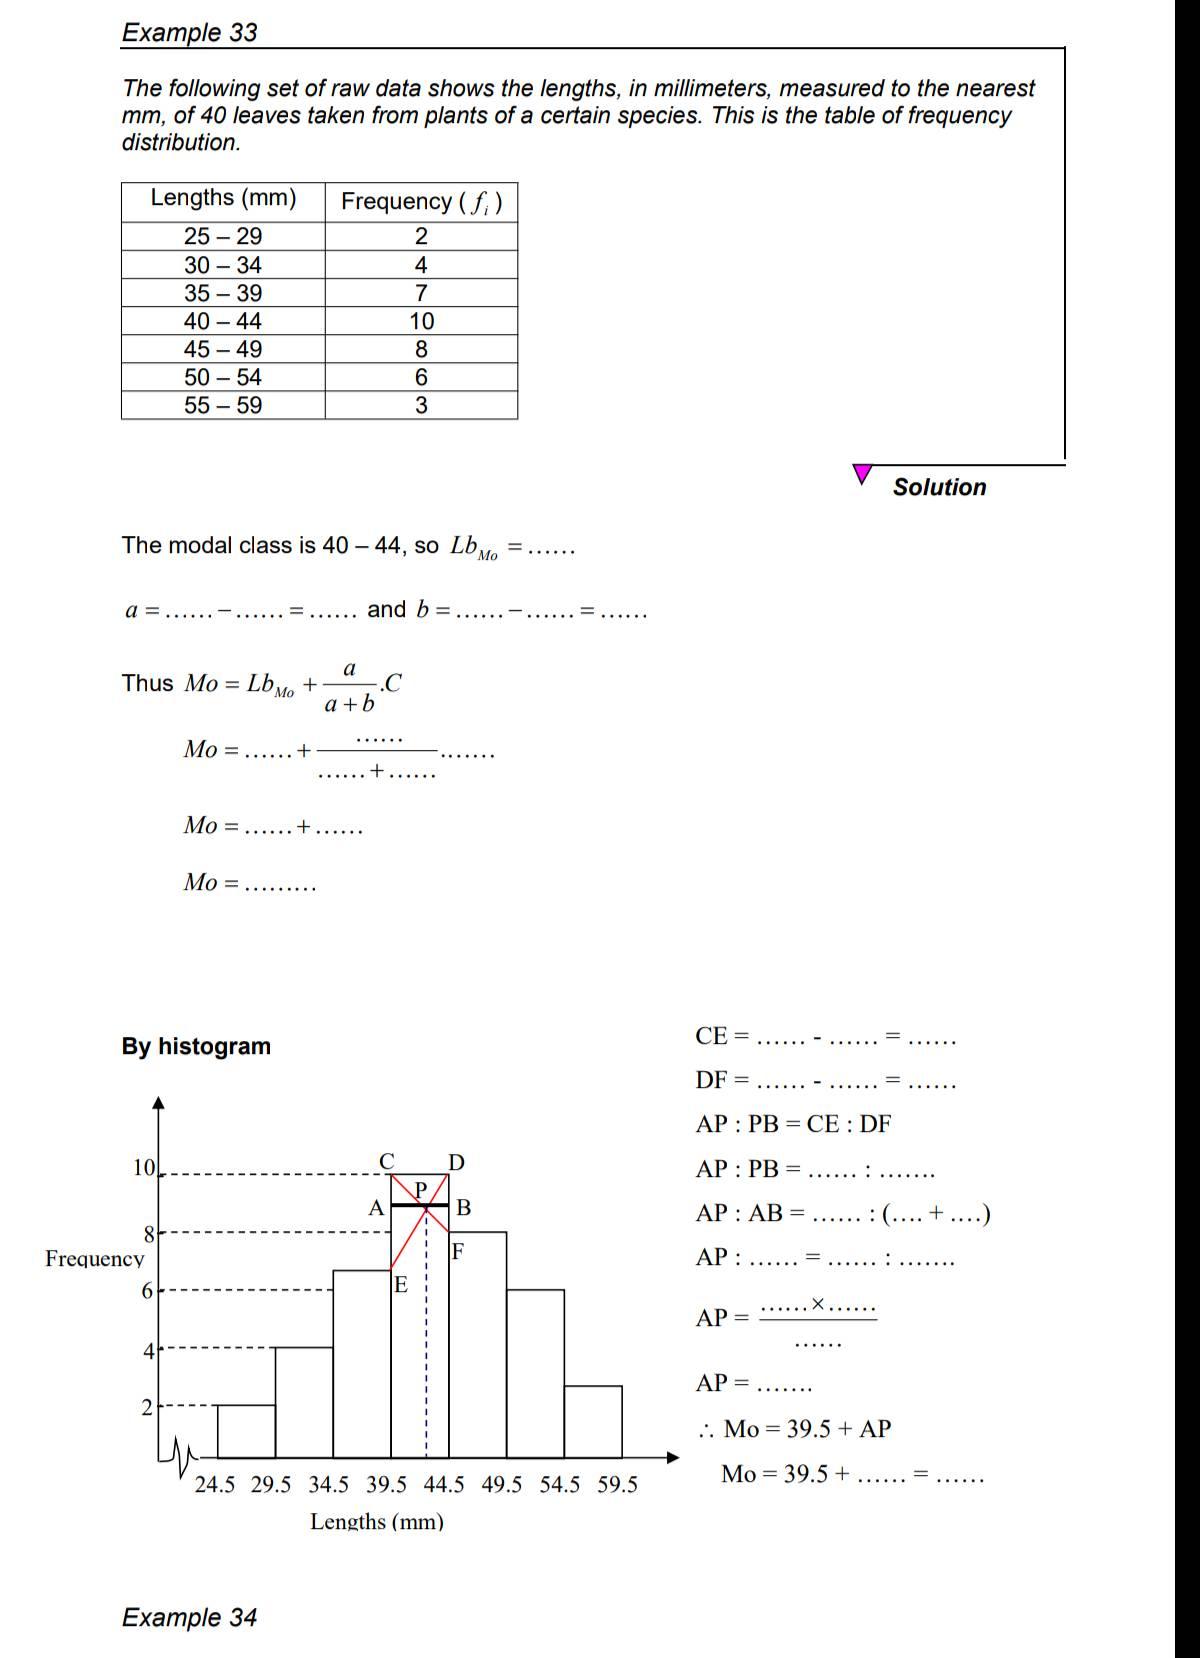
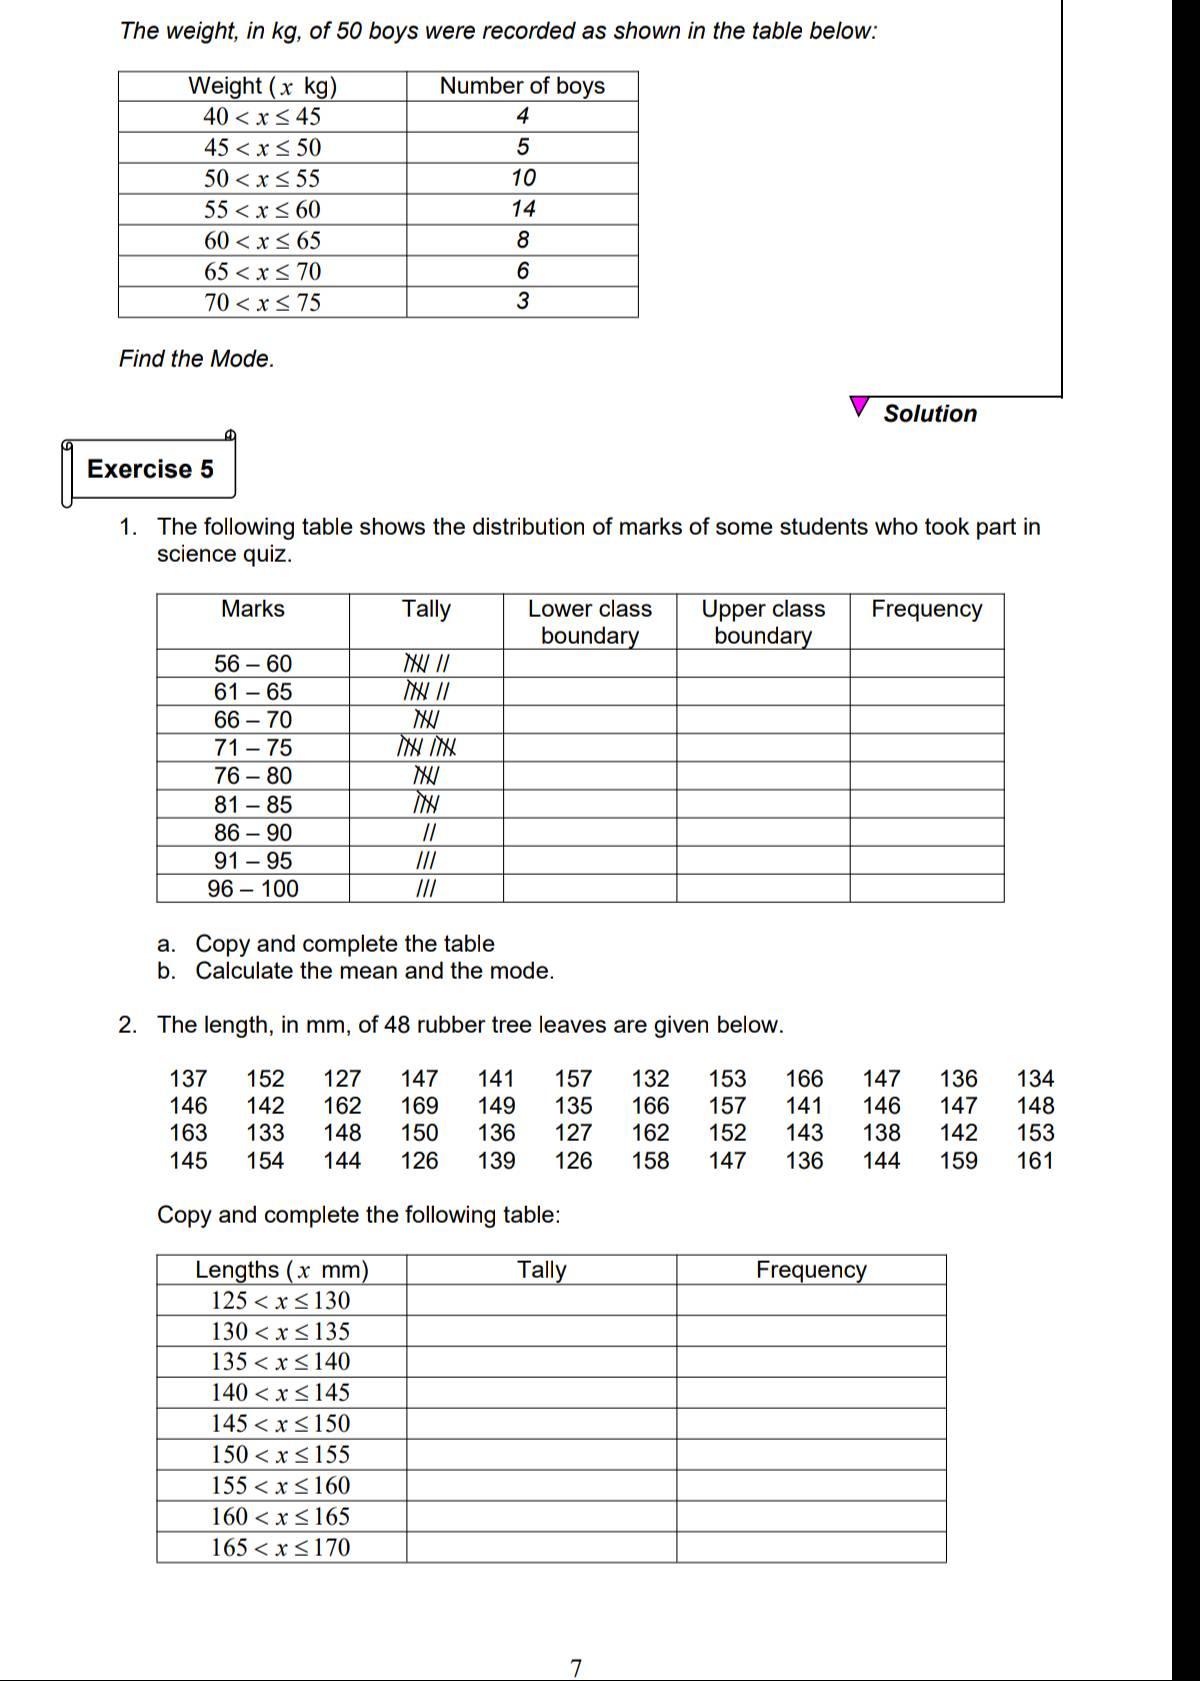
Example 33 The following set of raw data shows the lengths, in millimeters, measured to the nearest mm, of 40 leaves taken from plants of a certain species. This is the table of frequency distribution. Lengths (mm) Frequency ( f, ) 25 - 29 2 30 - 34 4 35 - 39 7 40 -44 10 45 - 49 8 50 - 54 6 55 - 59 3 Solution The modal class is 40 - 44, so LbM. = . ..... a= . ..... -......= ...... and b= ......-...... =. . .... Thus Mo = LbMo + a -.C atb Mo = ......+ . . .... ...... . . ....+ .. .... Mo = ......+ ...... MO = . . . . ..... By histogram CE = . . .. .. - .. .. .. ...... DF = .. . ...-.. AP : PB = CE : DF 10 AP : PB = ...... . .. ..... P A B AP : AB = ...... : (.... + ....) Frequency AP : ...... = ...... . ....... AP - ....X ...... . . . . . . 4 AP= ....... .. Mo = 39.5 + AP 24.5 29.5 34.5 39.5 44.5 49.5 54.5 59.5 Mo = 39.5 + ...... =...... Lengths (mm) Example 34The weight, in kg, of 50 boys were recorded as shown in the table below: 55
Step by Step Solution
There are 3 Steps involved in it

Get step-by-step solutions from verified subject matter experts