

Question: Please help me with these questions. Having a hard time understanding. The following is a table of the amount of time self-reported time, measured in
Please help me with these questions. Having a hard time understanding.
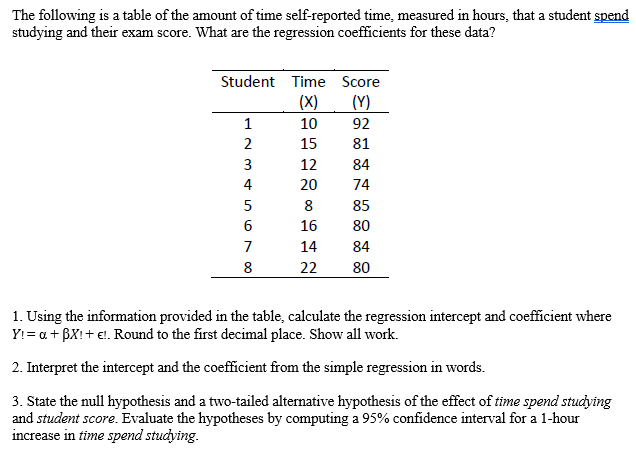
The following is a table of the amount of time self-reported time, measured in hours, that a student spend studying and their exam score. What are the regression coefficients for these data? Student Time Score (X) (Y) 10 92 15 81 12 84 20 74 ONOURWNA 8 85 16 80 14 84 22 80 1. Using the information provided in the table, calculate the regression intercept and coefficient where Y!= a + BX!+ 6. Round to the first decimal place. Show all work. 2. Interpret the intercept and the coefficient from the simple regression in words. 3. State the null hypothesis and a two-tailed alternative hypothesis of the effect of time spend studying and student score. Evaluate the hypotheses by computing a 95% confidence interval for a 1-hour increase in time spend studying
Step by Step Solution
There are 3 Steps involved in it

Get step-by-step solutions from verified subject matter experts