

Question: Please help me with these. Thank you. Please include all the solutions needed. 1. Listed below is the annual rate of return (reported in percent)
Please help me with these. Thank you. Please include all the solutions needed.
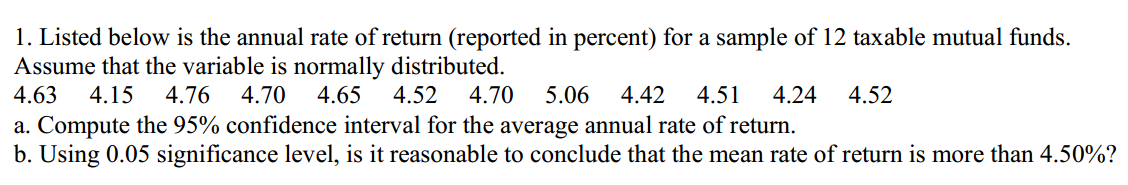
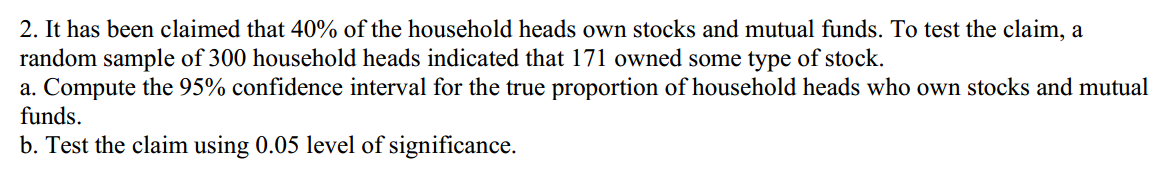
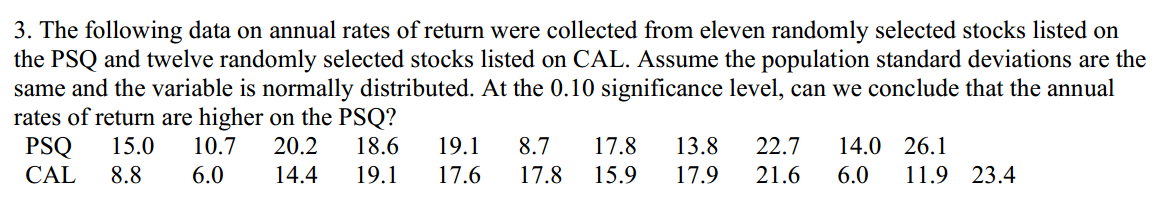
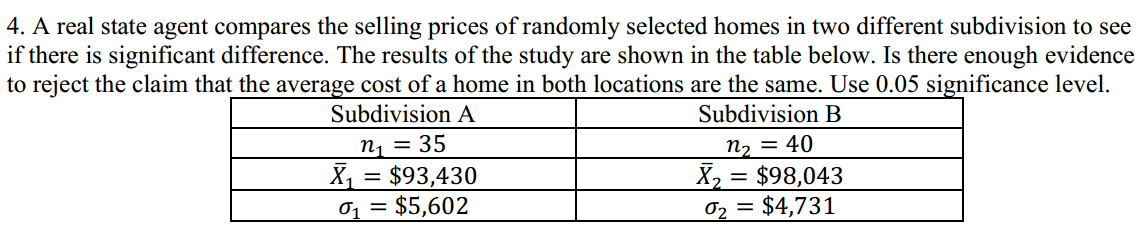
1. Listed below is the annual rate of return (reported in percent) for a sample of 12 taxable mutual funds. Assume that the variable is normally distributed. 4.63 4.15 4.76 4.70 4.65 4.52 4.70 5.06 4.42 4.51 4.24 4.52 a. Compute the 95% confidence interval for the average annual rate of return. b. Using 0.05 significance level, is it reasonable to conclude that the mean rate of return is more than 4.50%?2. It has been claimed that 40% of the household heads own stocks and mutual funds. To test the claim, a random sample of 300 household heads indicated that 171 owned some type of stock. a. Compute the 95% confidence interval for the true proportion of household heads who own stocks and mutual funds. b. Test the claim using 0.05 level of significance.3. The following data on annual rates of return were collected from eleven randomly selected stocks listed on the PSQ and twelve randomly selected stocks listed on CAL. Assume the population standard deviations are the same and the variable is normally distributed. At the 0.10 significance level, can we conclude that the annual rates of return are higher on the PSQ? PSQ 15.0 10.7 20.2 18.6 19.1 8.7 17.8 13.8 22.7 14.0 26.1 CAL 8.8 6.0 14.4 19.1 17.6 17.8 15.9 17.9 21.6 6.0 11.9 23.44. A real state agent compares the selling prices of randomly selected homes in two different subdivision to see if there is significant difference. The results of the study are shown in the table below. Is there enough evidence to reject the claim that the average cost of a home in both locations are the same. Use 0.05 significance level. Subdivision A Subdivision B n1 = 35 n2 = 40 X1 = $93,430 X2 = $98,043 01 = $5,602 02 = $4,7315. Use the data in number 3 and test whether the variances of the annual rates of return for PSQ and CAL are the same
Step by Step Solution
There are 3 Steps involved in it

Get step-by-step solutions from verified subject matter experts