

Question: please help me with this 3 problems. how about now? and it should be in excel Problem 1. Now you would like to see a
please help me with this 3 problems.
how about now? and it should be in excel
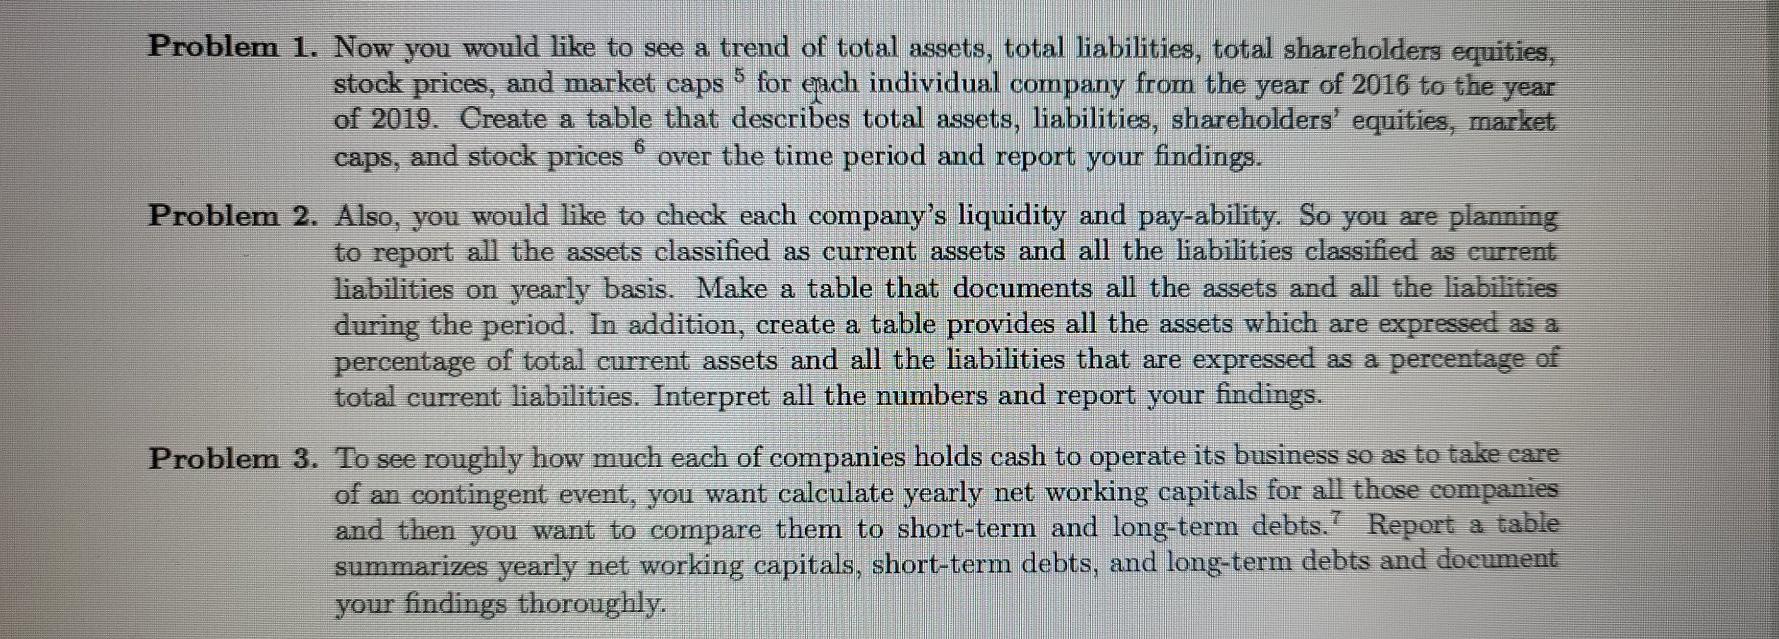
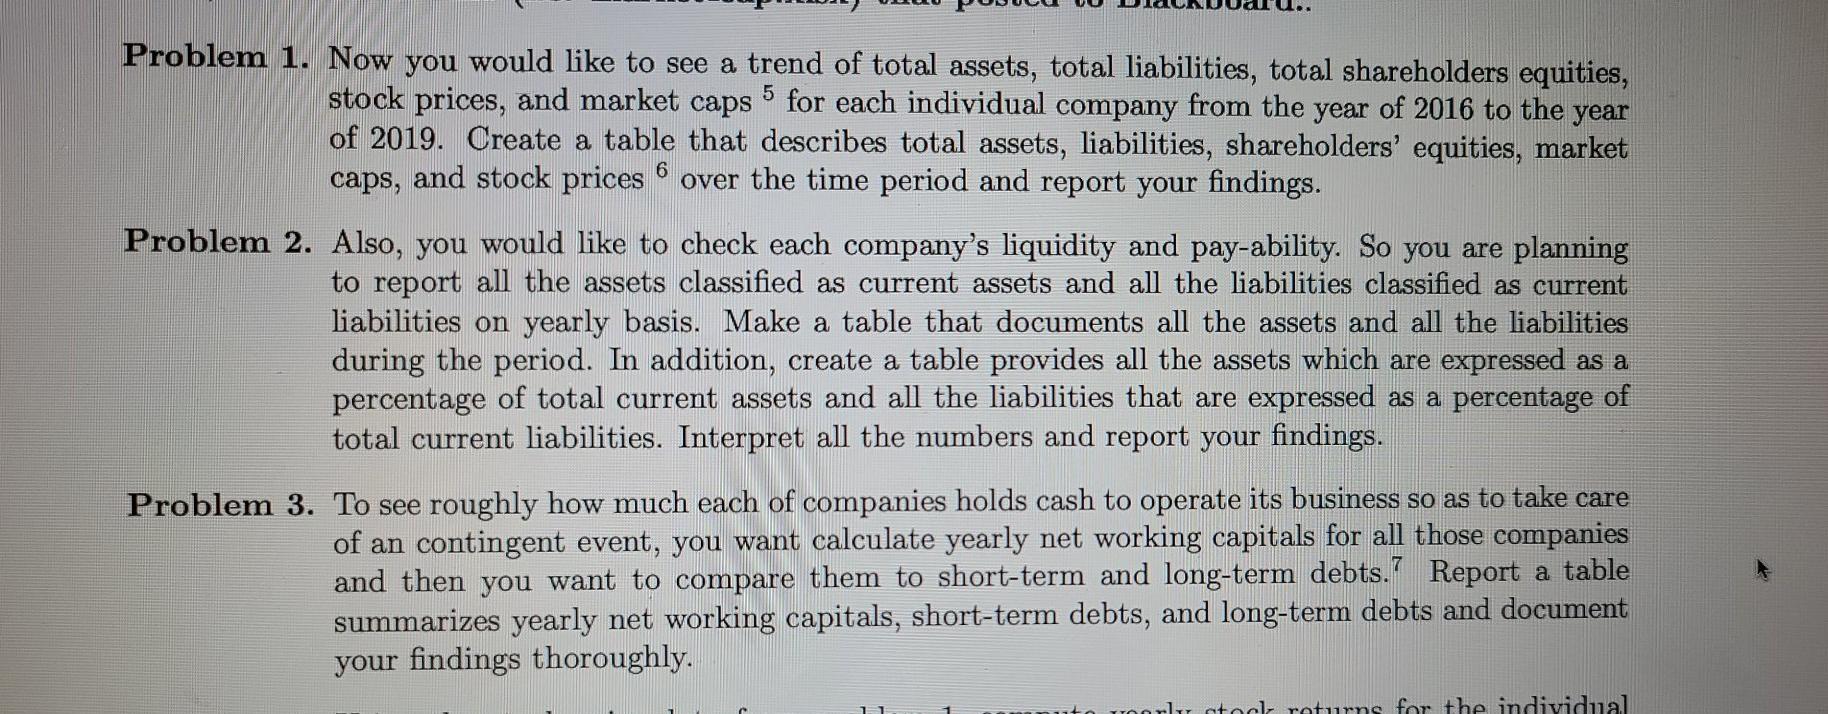
Problem 1. Now you would like to see a trend of total assets, total liabilities, total shareholders equities, stock prices, and market caps 5 for each individual company from the year of 2016 to the year of 2019. Create a table that describes total assets, liabilities, shareholders' equities, market caps, and stock prices over the time period and report your findings. Problem 2. Also, you would like to check each company's liquidity and pay-ability. So you are planning to report all the assets classified as current assets and all the liabilities classified as current liabilities on yearly basis. Make a table that documents all the assets and all the liabilities during the period. In addition, create a table provides all the assets which are expressed as a percentage of total current assets and all the liabilities that are expressed as a percentage of total current liabilities. Interpret all the numbers and report your findings. Problem 3. To see roughly how much each of companies holds cash to operate its business so as to take care of an contingent event, you want calculate yearly net working capitals for all those companies and then you want to compare them to short-term and long-term debts.? Report a table summarizes yearly net working capitals, short-term debts, and long-term debts and document your findings thoroughly. 6 Problem 1. Now you would like to see a trend of total assets, total liabilities, total shareholders equities, stock prices, and market caps for each individual company from the year of 2016 to the year of 2019. Create a table that describes total assets, liabilities, shareholders' equities, market caps, and stock prices over the time period and report your findings. Problem 2. Also, you would like to check each company's liquidity and pay-ability. So you are planning to report all the assets classified as current assets and all the liabilities classified as current liabilities on yearly basis. Make a table that documents all the assets and all the liabilities during the period. In addition, create a table provides all the assets which are expressed as a percentage of total current assets and all the liabilities that are expressed as a percentage of total current liabilities. Interpret all the numbers and report your findings. Problem 3. To see roughly how much each of companies holds cash to operate its business so as to take care of an contingent event, you want calculate yearly net working capitals for all those companies and then you want to compare them to short-term and long-term debts.' Report a table summarizes yearly net working capitals, short-term debts, and long-term debts and document your findings thoroughly. zorlu stock returns for the individual Problem 1. Now you would like to see a trend of total assets, total liabilities, total shareholders equities, stock prices, and market caps 5 for each individual company from the year of 2016 to the year of 2019. Create a table that describes total assets, liabilities, shareholders' equities, market caps, and stock prices over the time period and report your findings. Problem 2. Also, you would like to check each company's liquidity and pay-ability. So you are planning to report all the assets classified as current assets and all the liabilities classified as current liabilities on yearly basis. Make a table that documents all the assets and all the liabilities during the period. In addition, create a table provides all the assets which are expressed as a percentage of total current assets and all the liabilities that are expressed as a percentage of total current liabilities. Interpret all the numbers and report your findings. Problem 3. To see roughly how much each of companies holds cash to operate its business so as to take care of an contingent event, you want calculate yearly net working capitals for all those companies and then you want to compare them to short-term and long-term debts.? Report a table summarizes yearly net working capitals, short-term debts, and long-term debts and document your findings thoroughly. 6 Problem 1. Now you would like to see a trend of total assets, total liabilities, total shareholders equities, stock prices, and market caps for each individual company from the year of 2016 to the year of 2019. Create a table that describes total assets, liabilities, shareholders' equities, market caps, and stock prices over the time period and report your findings. Problem 2. Also, you would like to check each company's liquidity and pay-ability. So you are planning to report all the assets classified as current assets and all the liabilities classified as current liabilities on yearly basis. Make a table that documents all the assets and all the liabilities during the period. In addition, create a table provides all the assets which are expressed as a percentage of total current assets and all the liabilities that are expressed as a percentage of total current liabilities. Interpret all the numbers and report your findings. Problem 3. To see roughly how much each of companies holds cash to operate its business so as to take care of an contingent event, you want calculate yearly net working capitals for all those companies and then you want to compare them to short-term and long-term debts.' Report a table summarizes yearly net working capitals, short-term debts, and long-term debts and document your findings thoroughly. zorlu stock returns for the individual
Step by Step Solution
There are 3 Steps involved in it

Get step-by-step solutions from verified subject matter experts