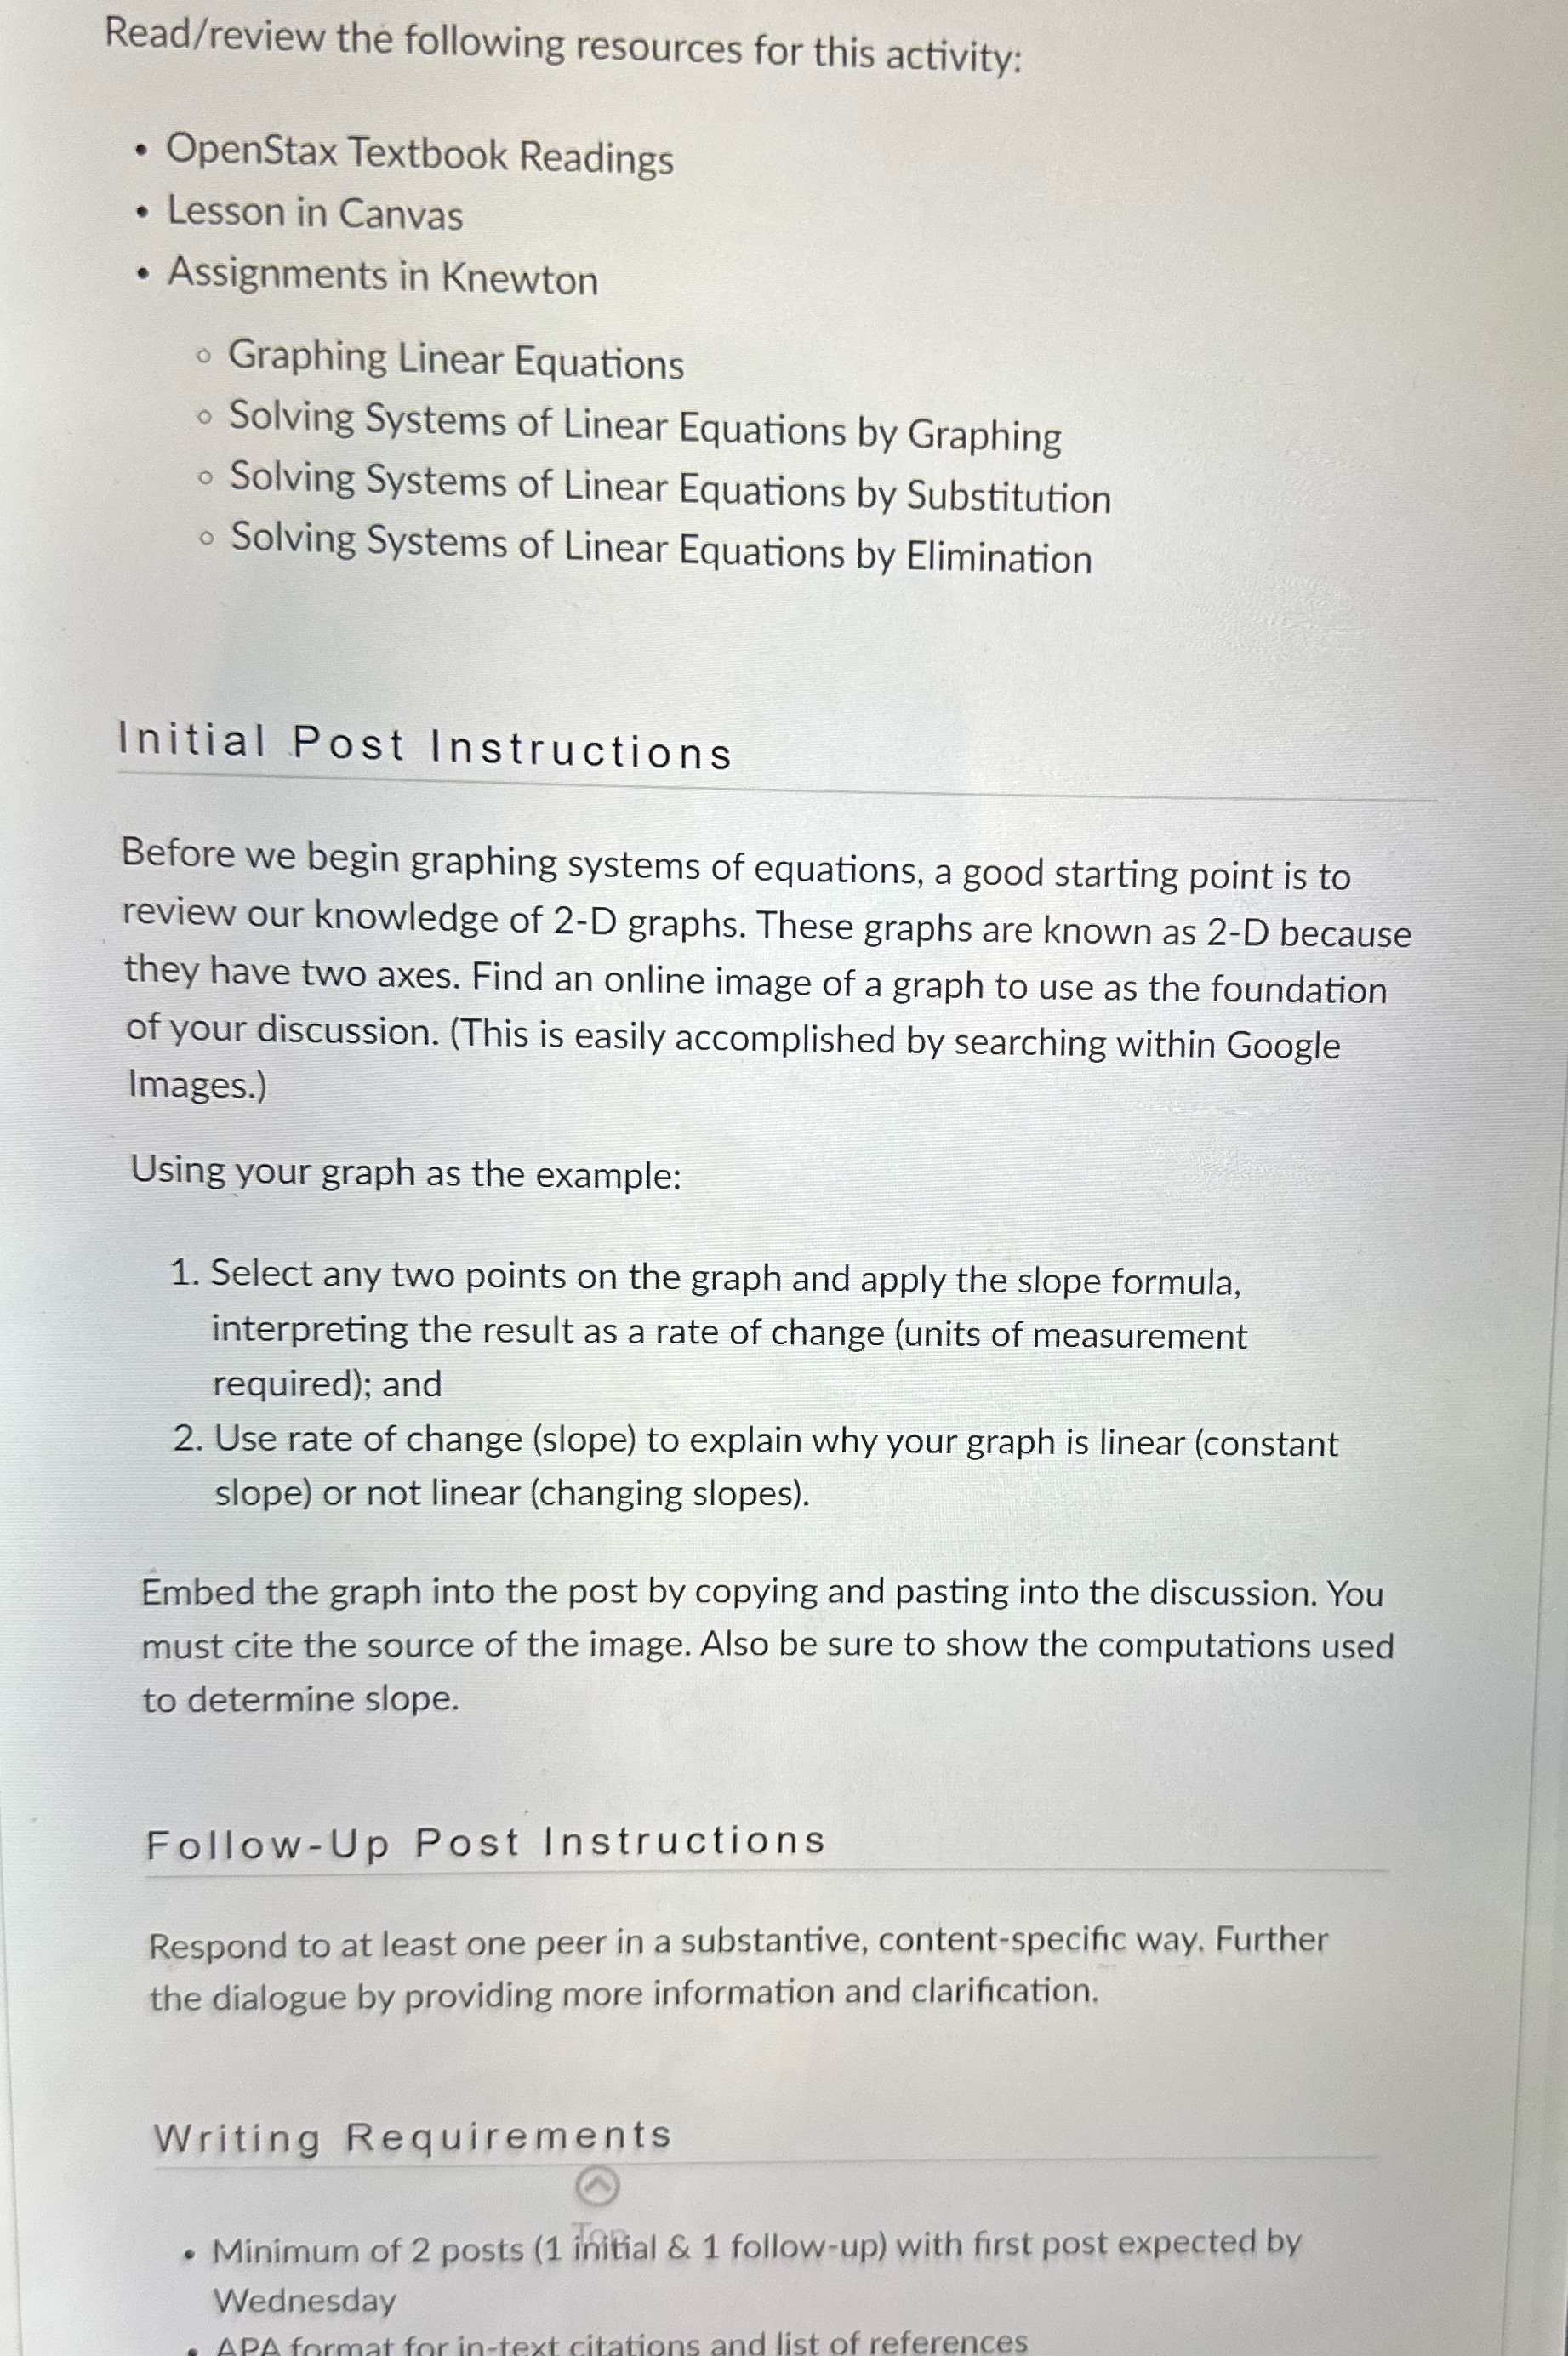
Question: Please help me with this and do the graph as well please Read/ review the following resources for this activity: . OpenStax Textbook Readings .

Please help me with this and do the graph as well please

Please help me with this and do the graph as well
Read/ review the following resources for this activity: . OpenStax Textbook Readings . Lesson in Canvas . Assignments in Knewton o Graphing Linear Equations 0 Solving Systems of Linear Equations by Graphing 0 Solving Systems of Linear Equations by Substitution 0 Solving Systems of Linear Equations by Elimination lnitial .Post Instructions Before we begin graphing systems of equations, a good starting point is to review our knowledge of 2-D graphs. These graphs are known as 2D because they have two axes. Find an online image of a graph to use as the foundation of your discussion. (This is easily accomplished by searching within Google Images.) Using your graph as the example: 1. Select any two points on the graph and apply the slope formula, interpreting the result as a rate of change (units of measurement required); and 2. Use rate of change (slope) to explain why your graph is linear (constant slope) or not linear (changing slopes). Embed the graph into the post by copying and pasting into the discussion. You must cite the source of the image. Also be sure to show the computations used to determine slope. FollowUp Post Instructions Respond to at least one peer in a substantive, content-specic way. Further the dialogue by providing more information and clarication. Writing Requirements . Minimum of 2 posts (1 initial & 1 follow-up) with rst post expected by Wednesday . ADA fnrmnt fnr in'fext citations and list of references

Step by Step Solution

There are 3 Steps involved in it

1 Expert Approved Answer
Step: 1 Unlock blur-text-image
Question Has Been Solved by an Expert!

Get step-by-step solutions from verified subject matter experts

Step: 2 Unlock
Step: 3 Unlock

Students Have Also Explored These Related Mathematics Questions!