

Question: Please help me with this assignment for Applied Statistics. I have to have the equations and numbers for the excel spreadsheet and then answer the
Please help me with this assignment for Applied Statistics. I have to have the equations and numbers for the excel spreadsheet and then answer the questions. Please attach a screenshot of the equations and answers in a excel spreadsheet. I have already asked other tutors and they keep submitting a regular chart or the answers written on paper but I need to see it in a screenshot of the excel spreadsheet. One with just equations and then one with answers. Please fill in the equations and answers to the HW worksheet attached.
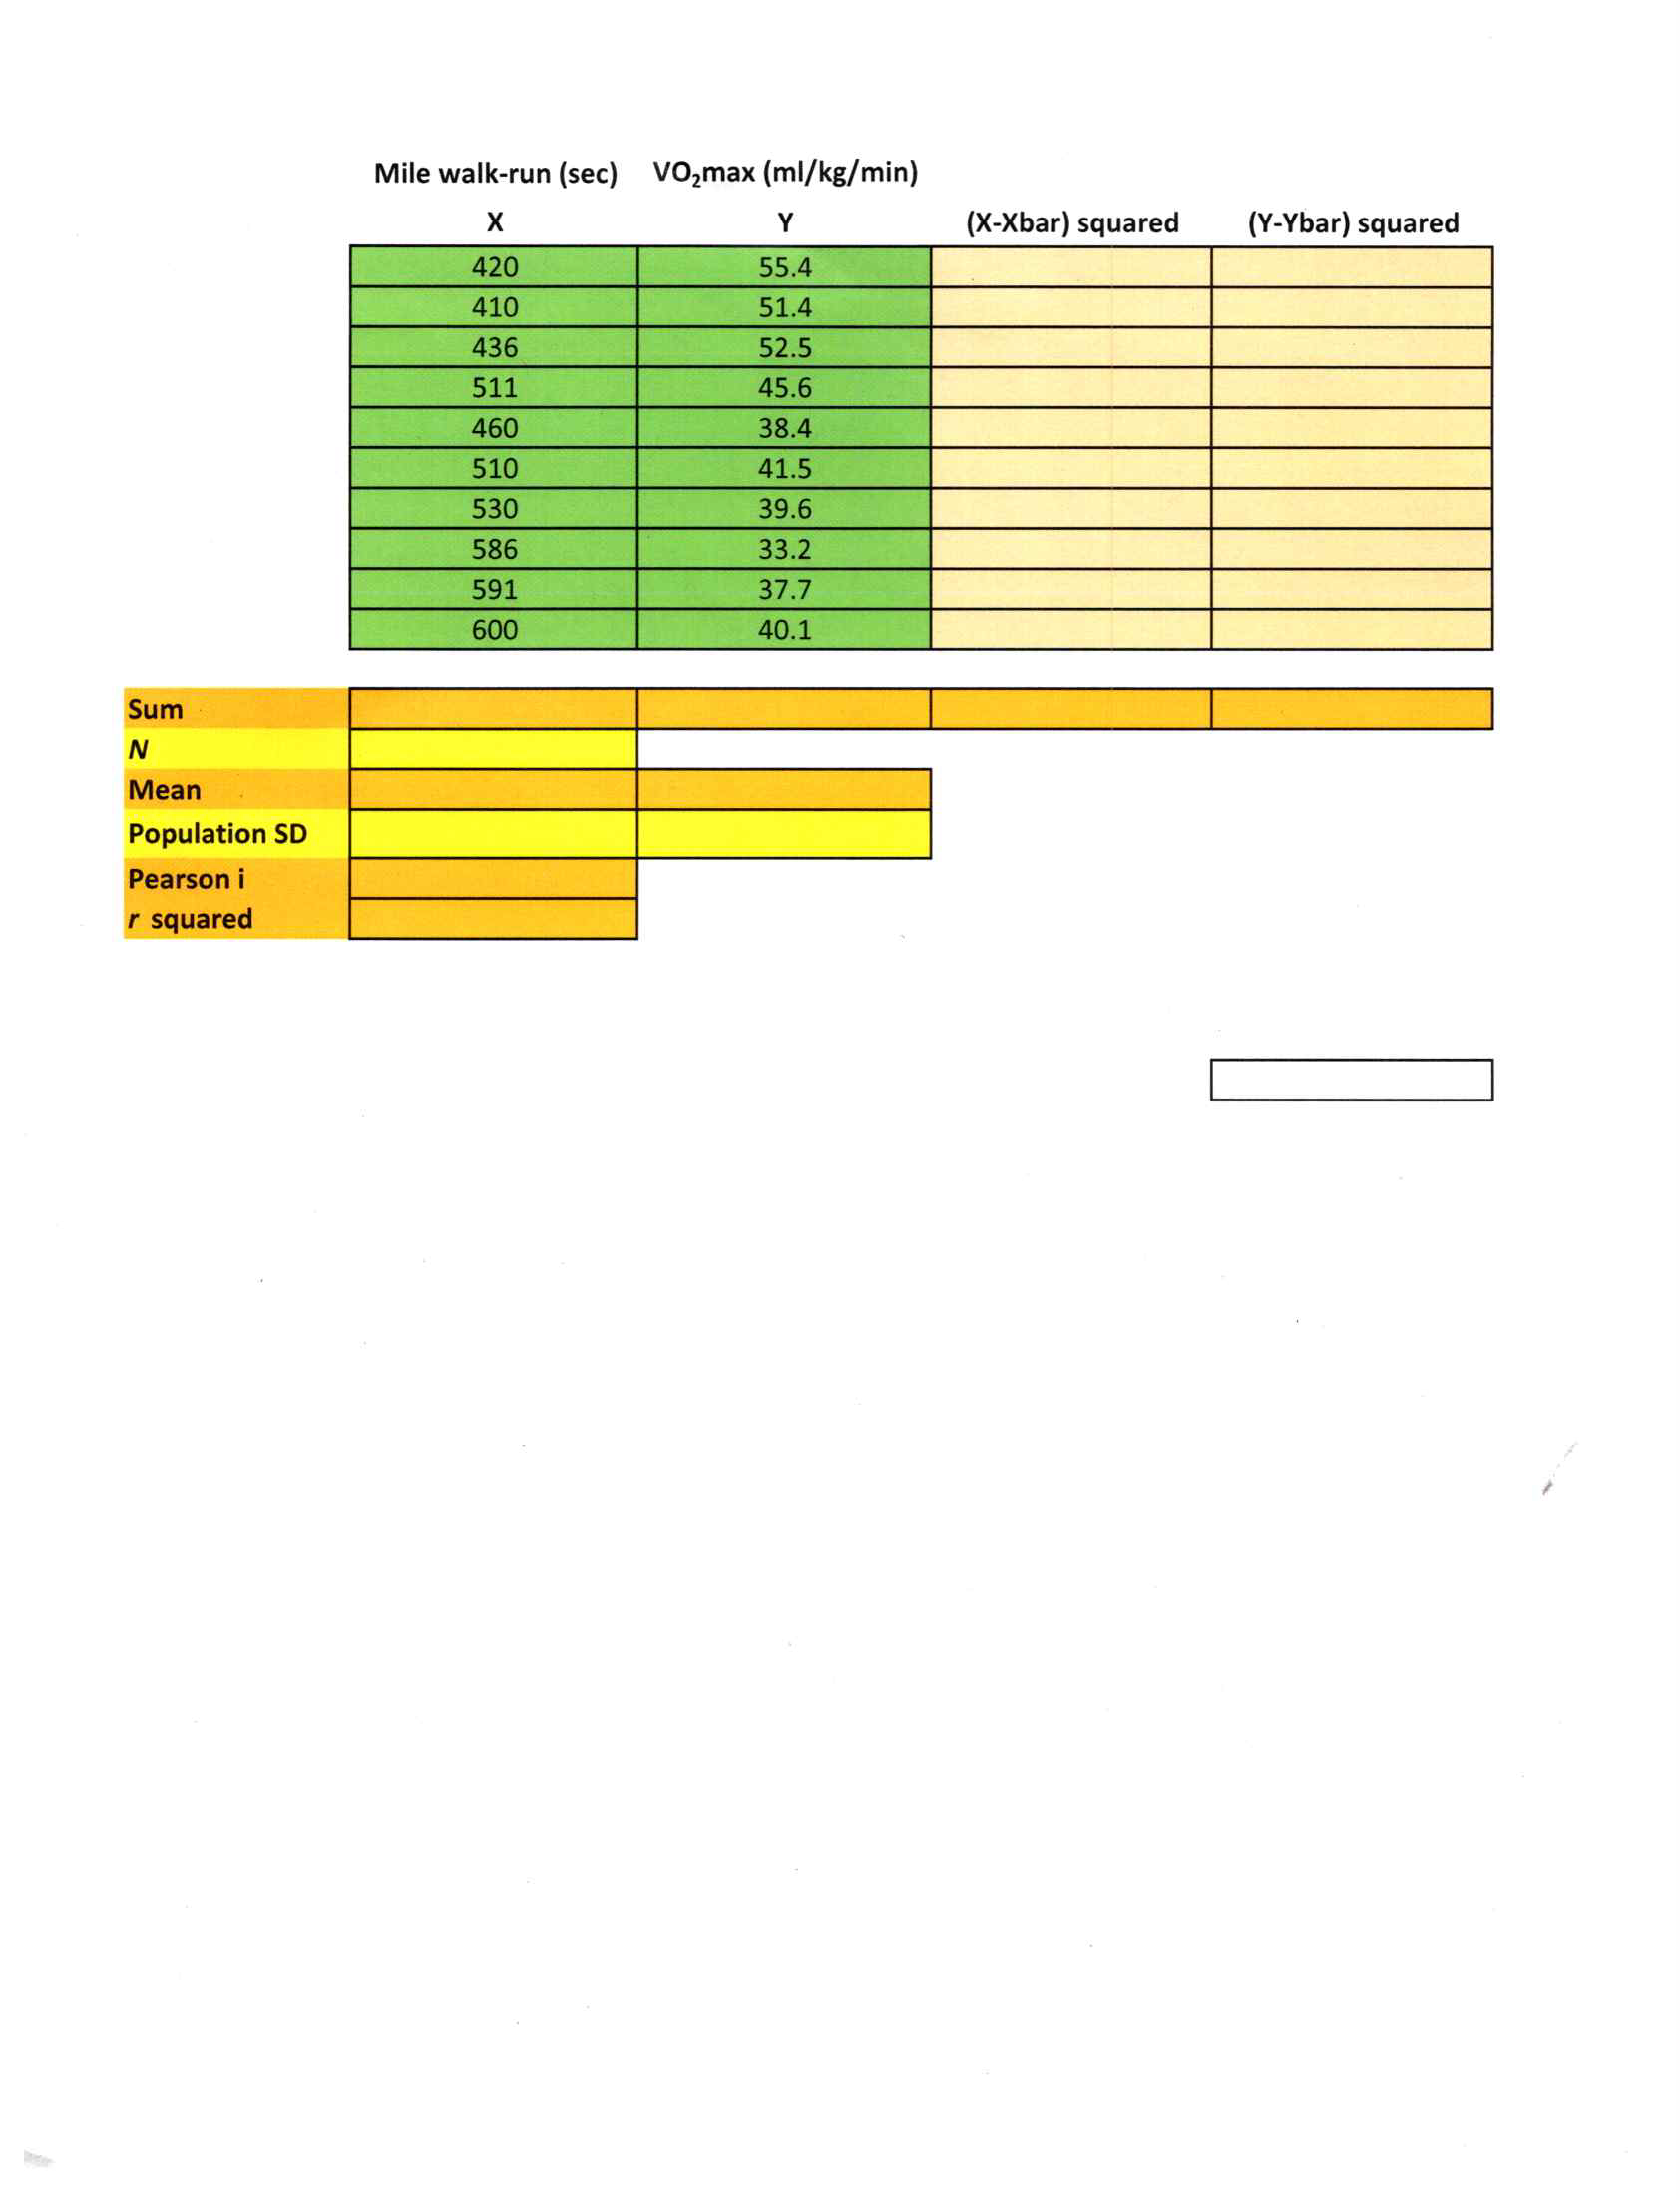
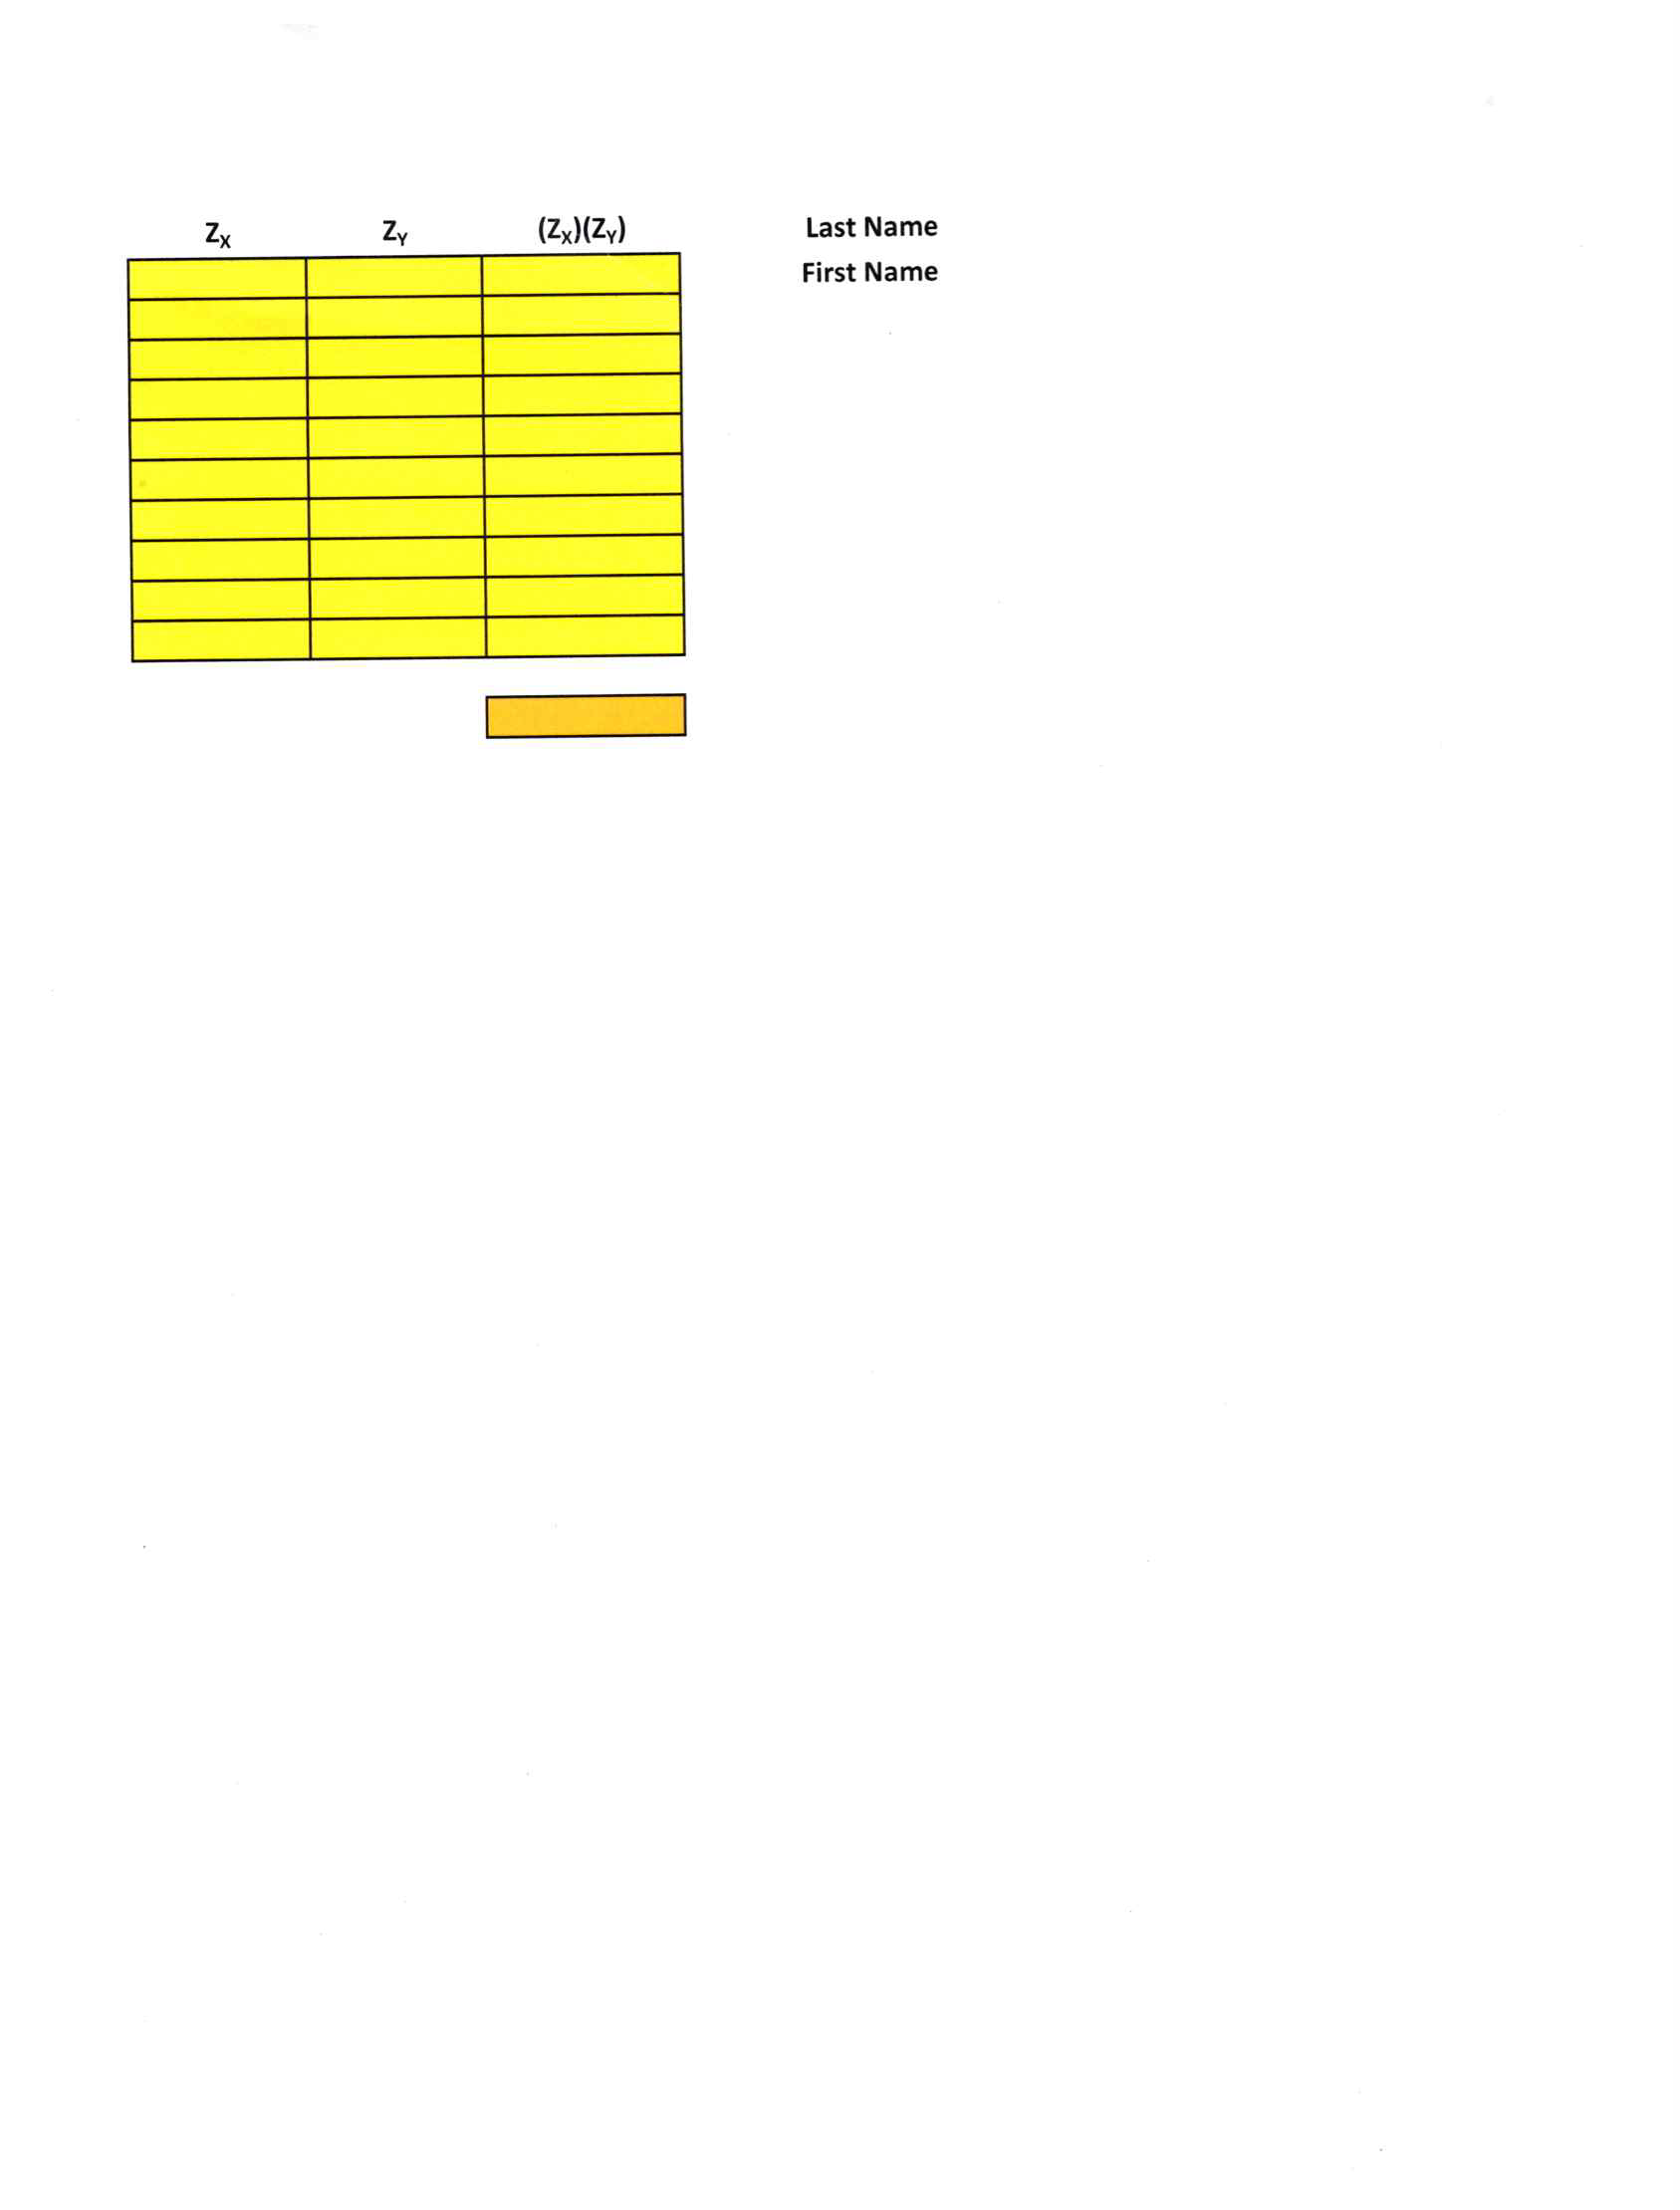
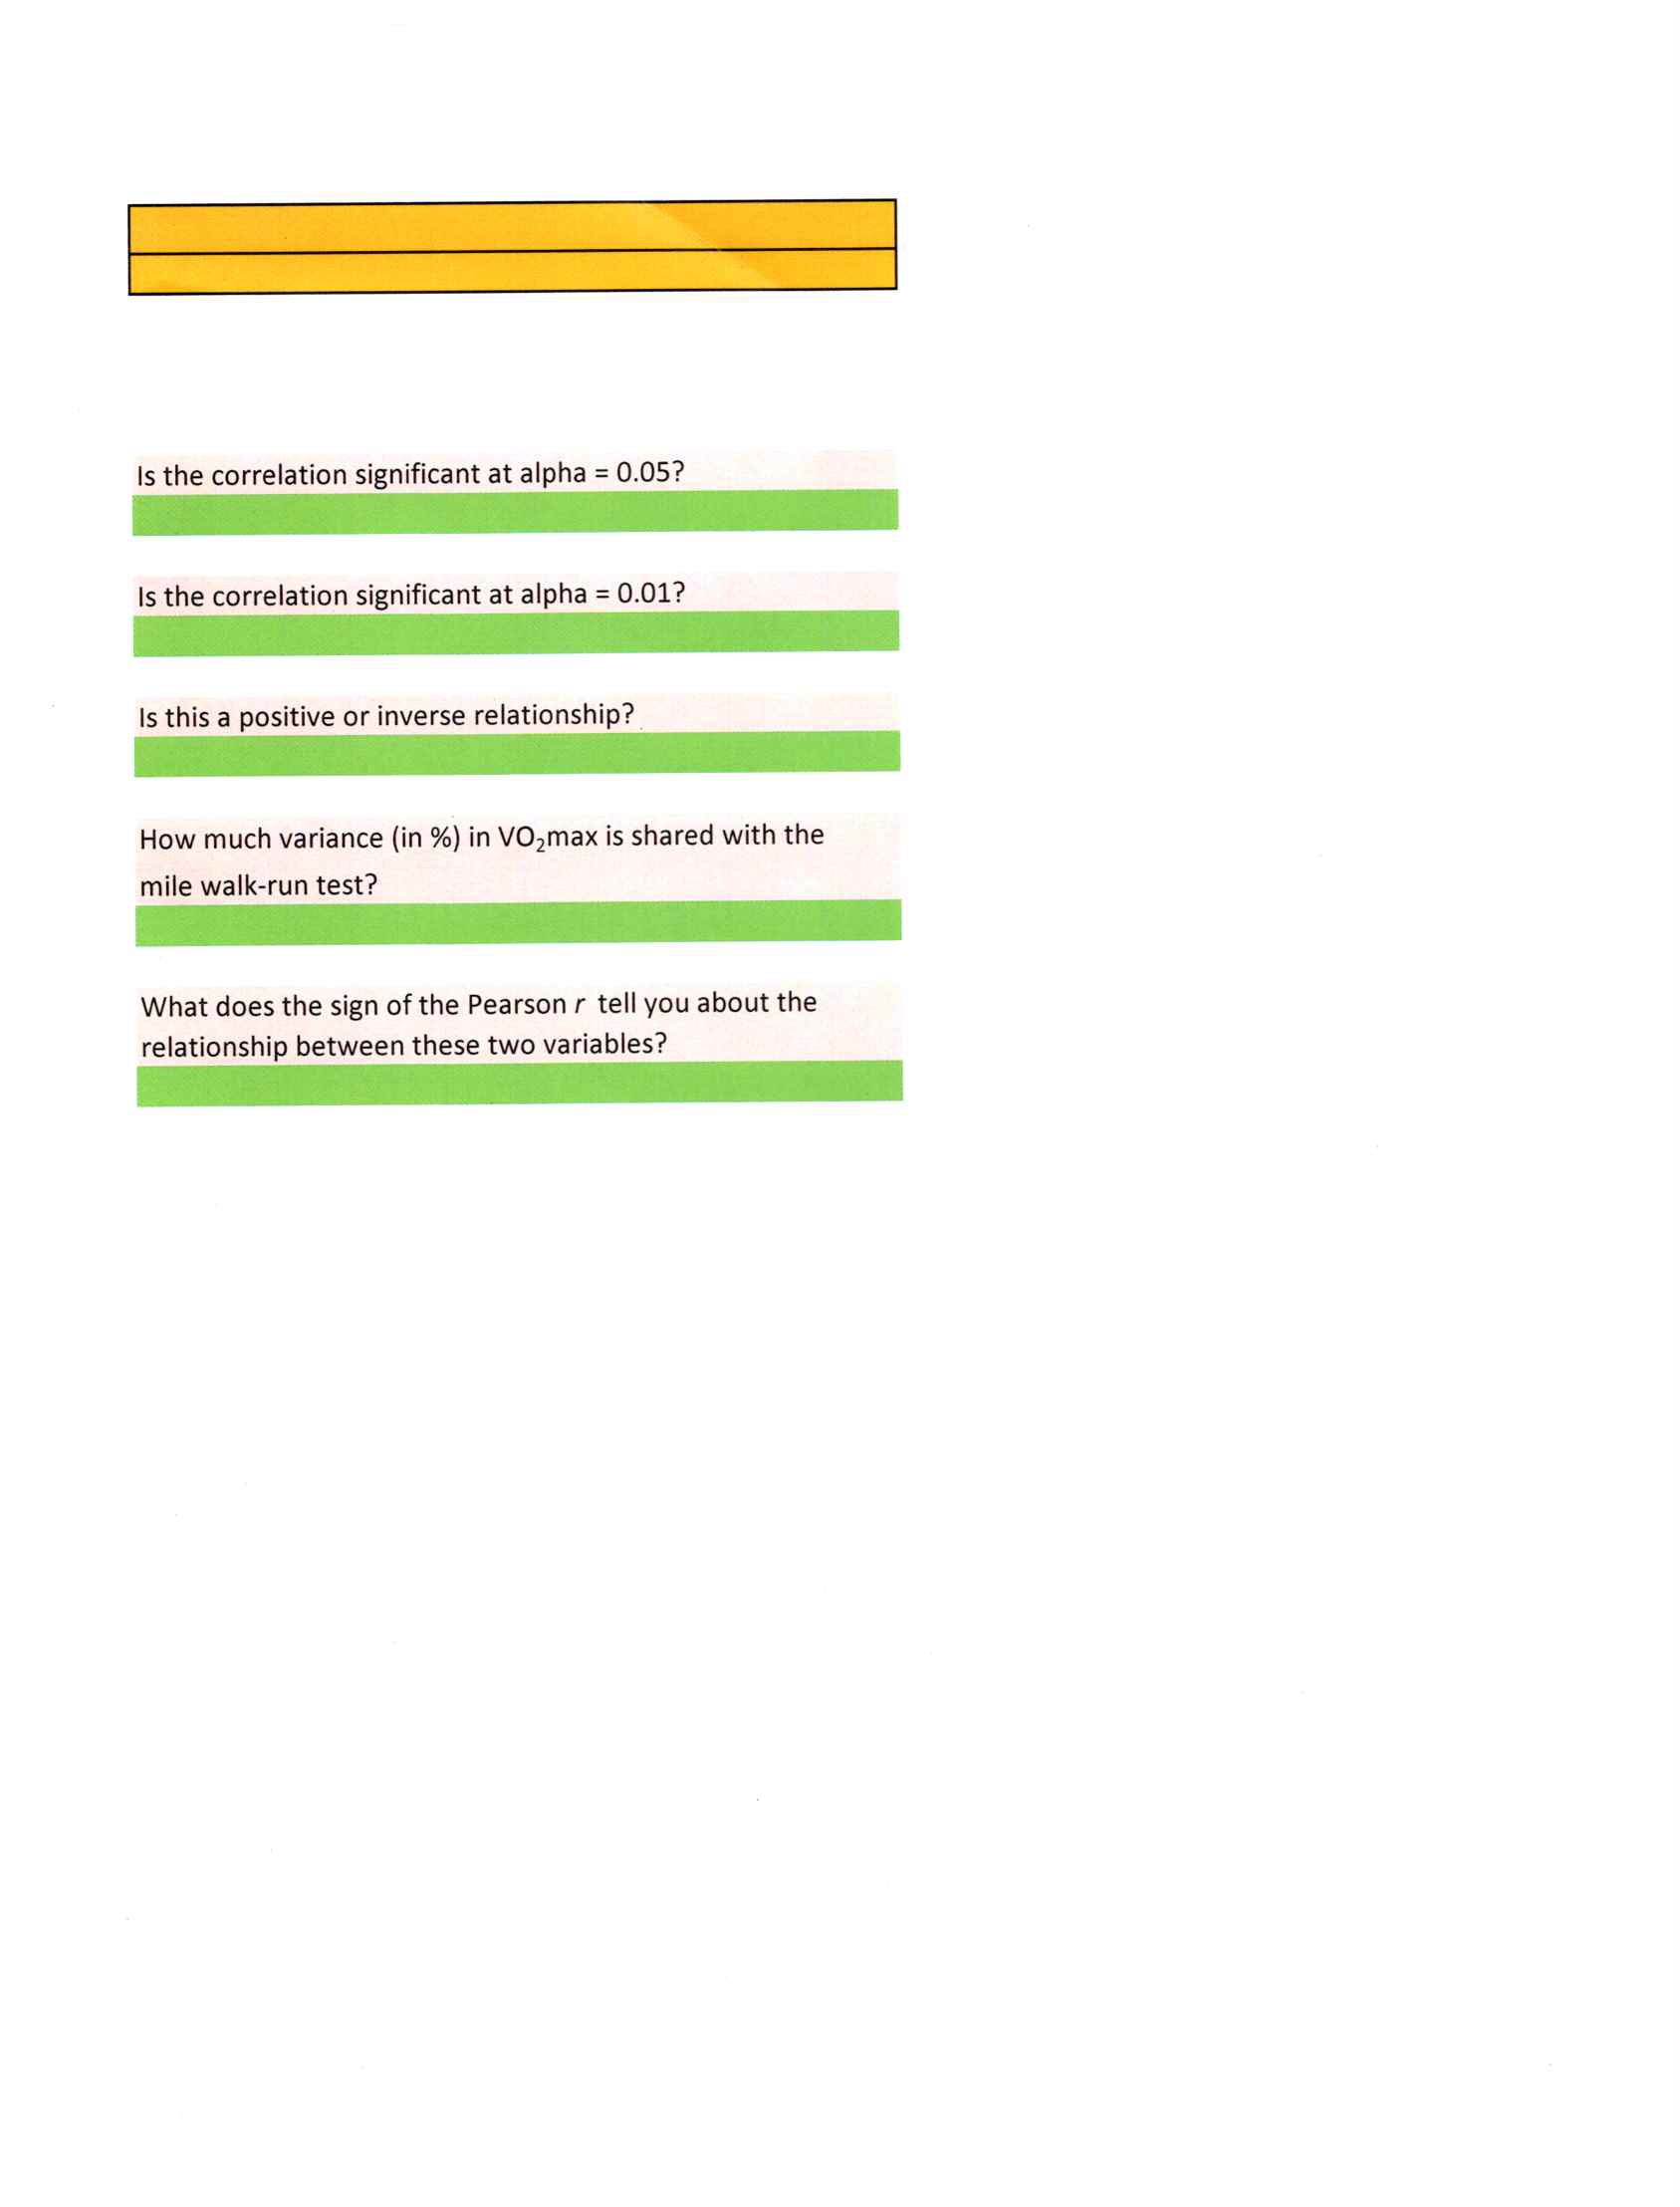
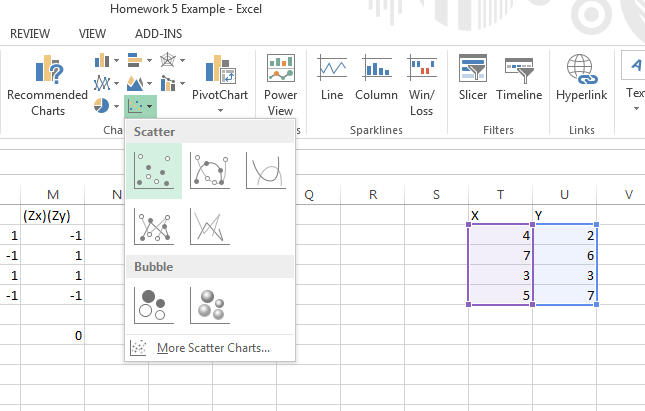
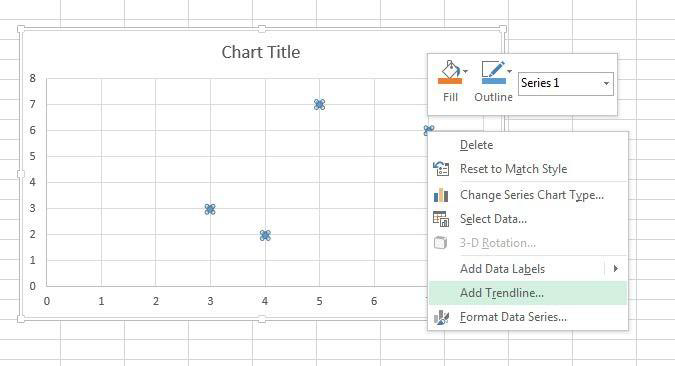
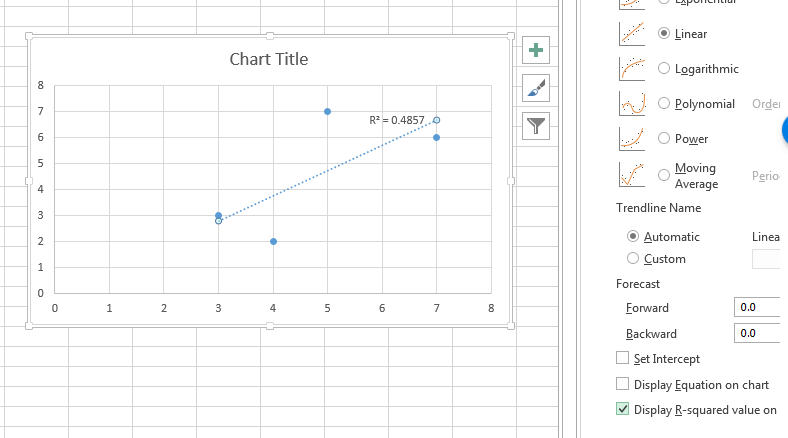
Instructions for Homework Assignment 5 For this homework, you will calculate the Pearson r and r2 between two variables. The X variable is time to walk or run a mile. The Y variable is VO2max (maximal oxygen consumption, the gold standard laboratory test of cardiovascular fitness) as determined by a laboratory exercise test. Using Excel equations, calculate Pearson r (treating the data set like a population data set) and the r2 using the definition formula; that is the calculations should appear similar to table 8.1 (as seen in the module 18 lecture) and include N, X mean, Y mean, SD of X, SD of Y, the sum of ZX*ZY, and r. For your SD calculations, you may use the formula =STDEV.P instead of going through the manual calculation of each SD. However if you are more comfortable using the full calculations, columns D and E are available for you. (You do not need to fill out columns D and E if you use STDEV.P.) Once you have completed the calculations, answer the questions in column J. Use table A.2 to answer questions about statistical significance. (Table A.2 is available in the appendix.) For 1 point extra credit, create a scatter plot of the data. This may be useful to check your work or help as a visual aid. First, highlight the X and Y columns of data, click on the INSERT tab, and select the scatter plot option.
Step by Step Solution
There are 3 Steps involved in it

Get step-by-step solutions from verified subject matter experts