

Question: Please help me with this assignment. Managing increased demand for ICU beds during the COVID-19 pandemic for the City of Toronto January 18th, 2021 Emma
Please help me with this assignment.
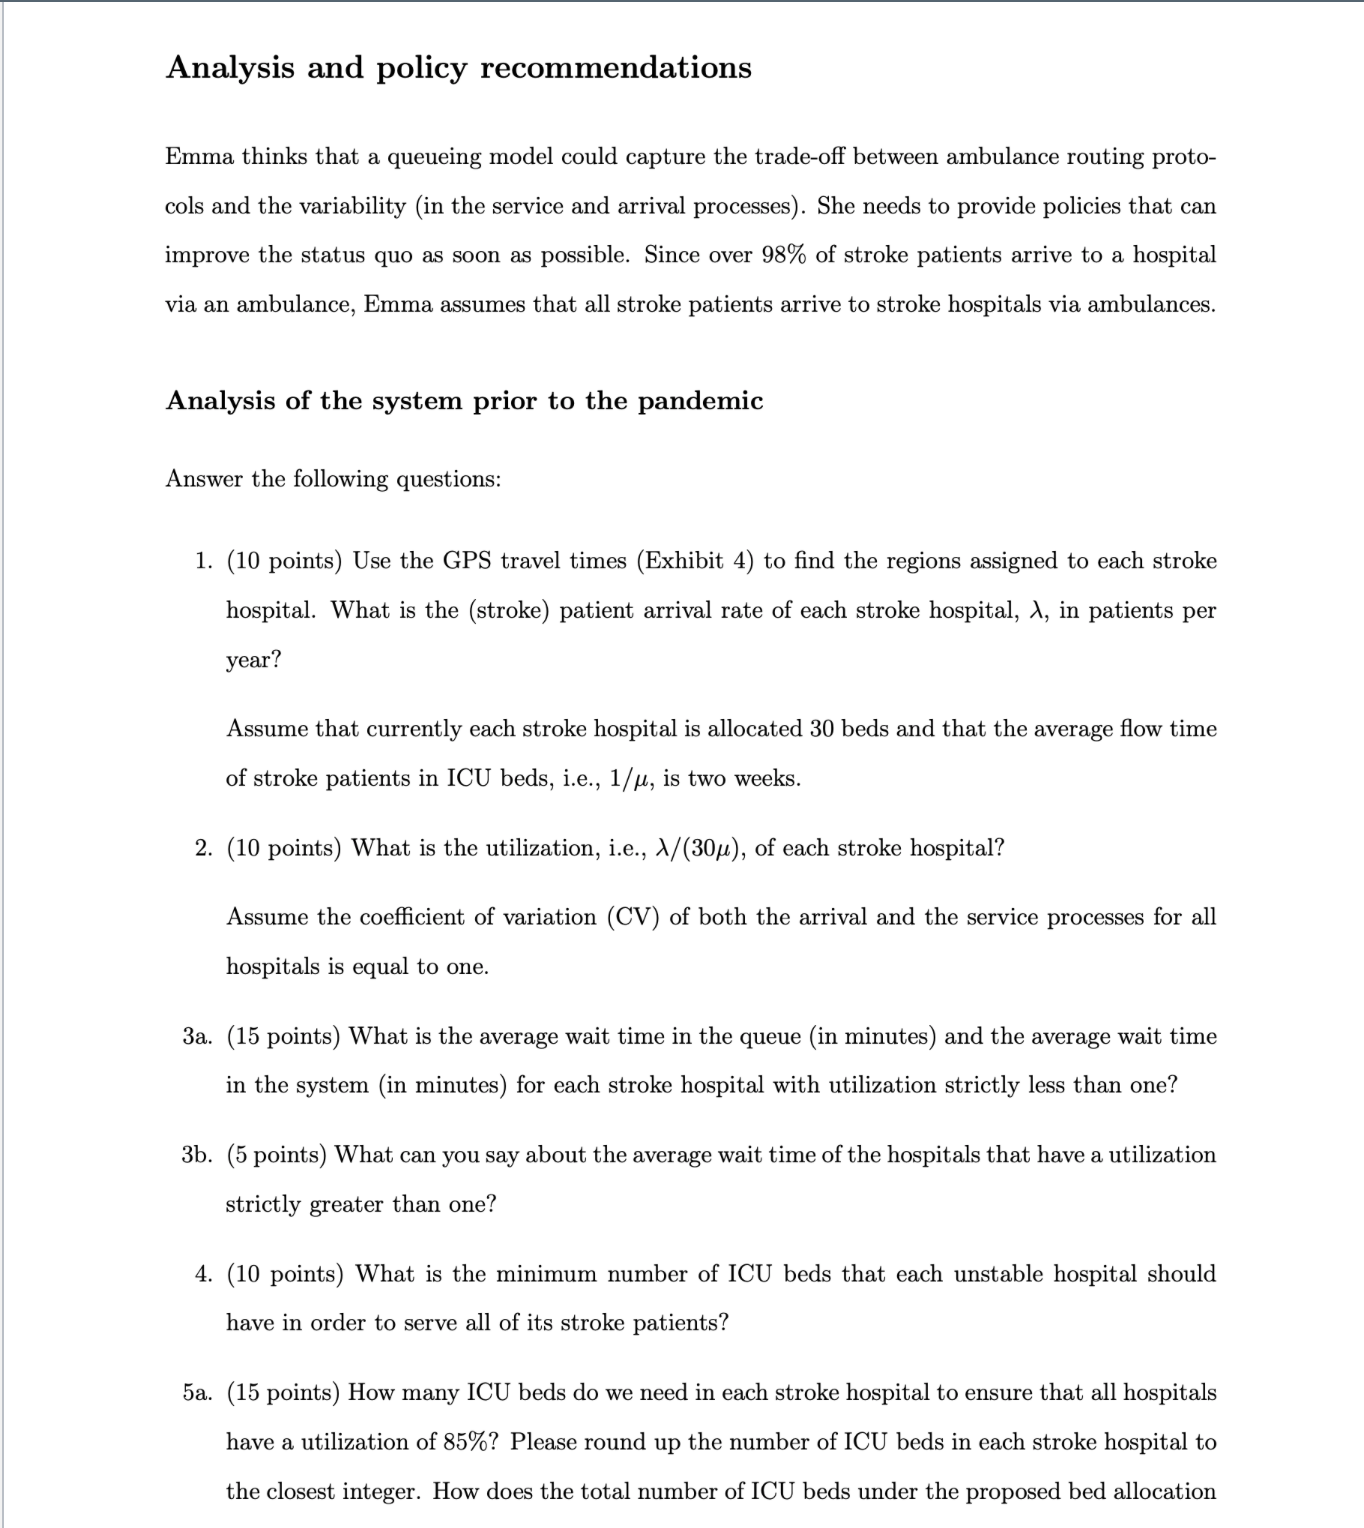
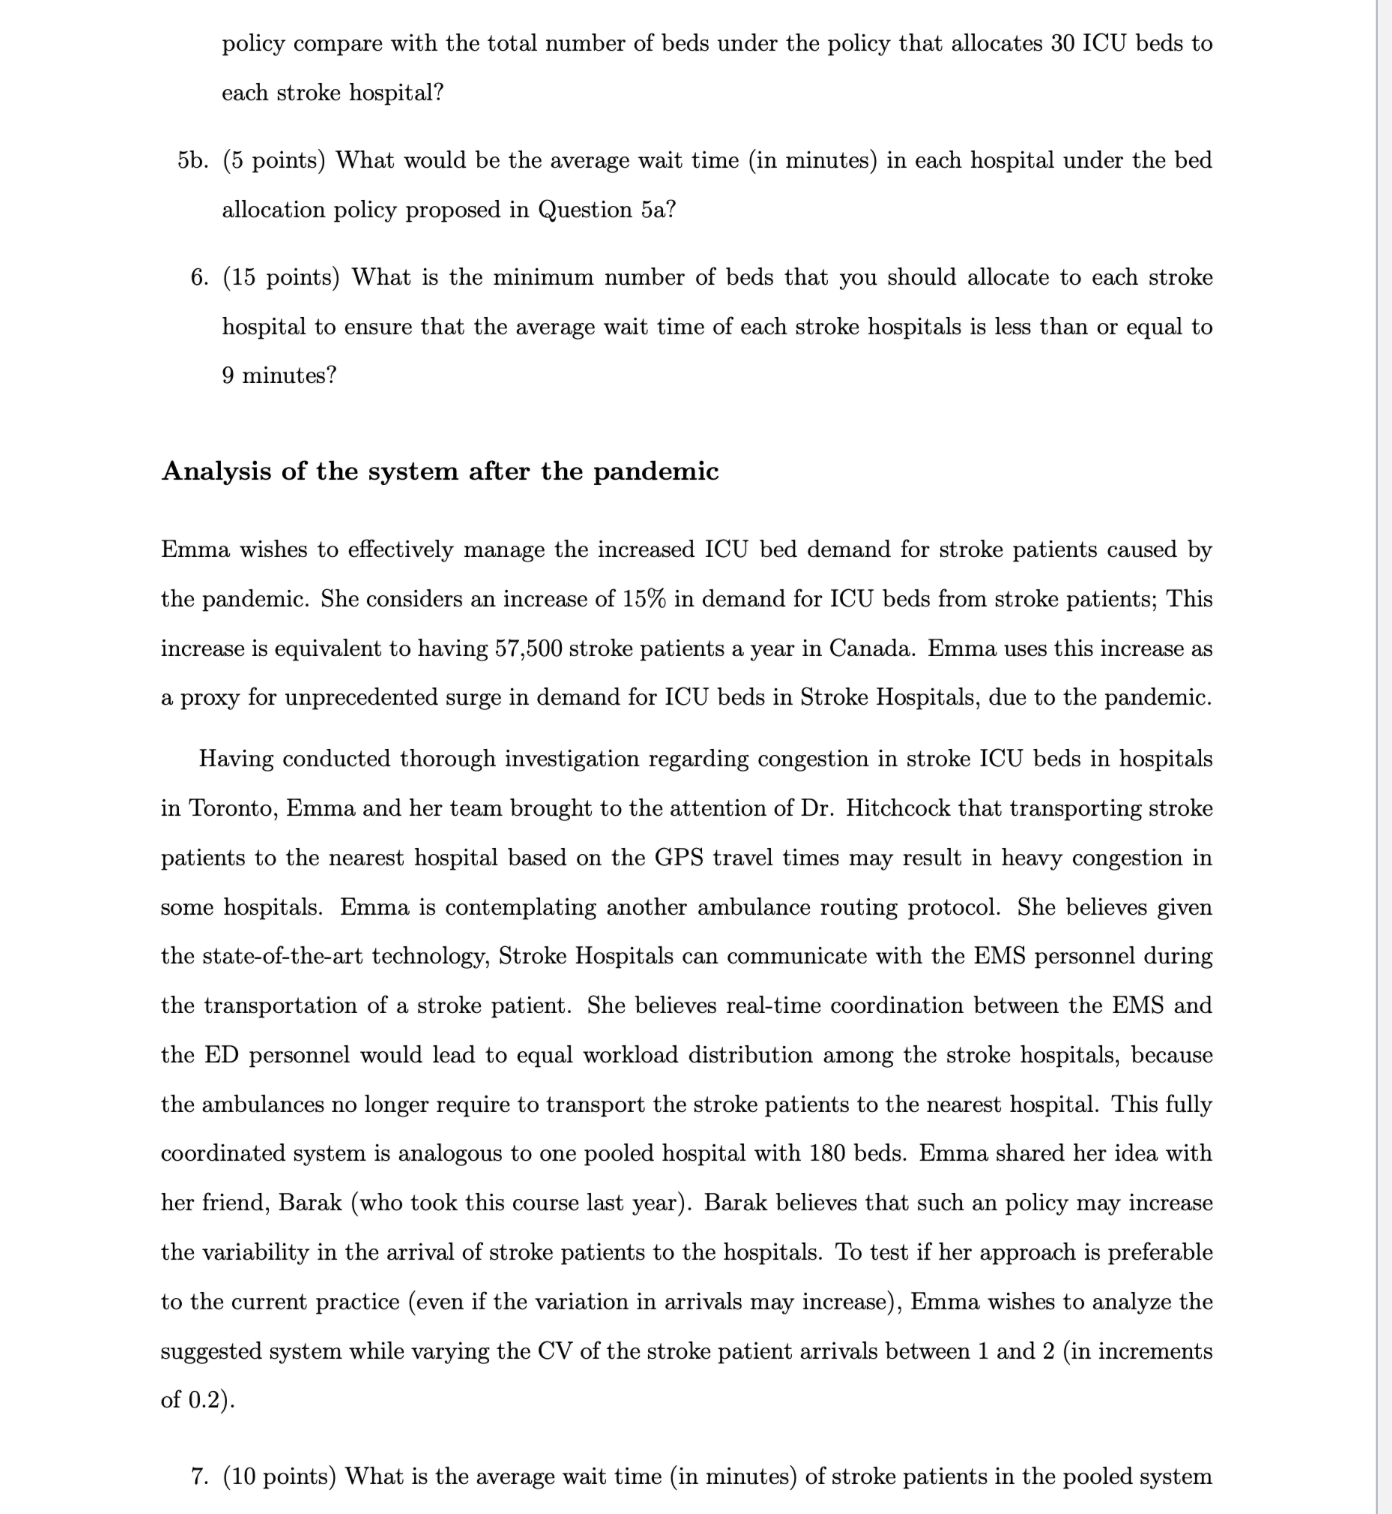
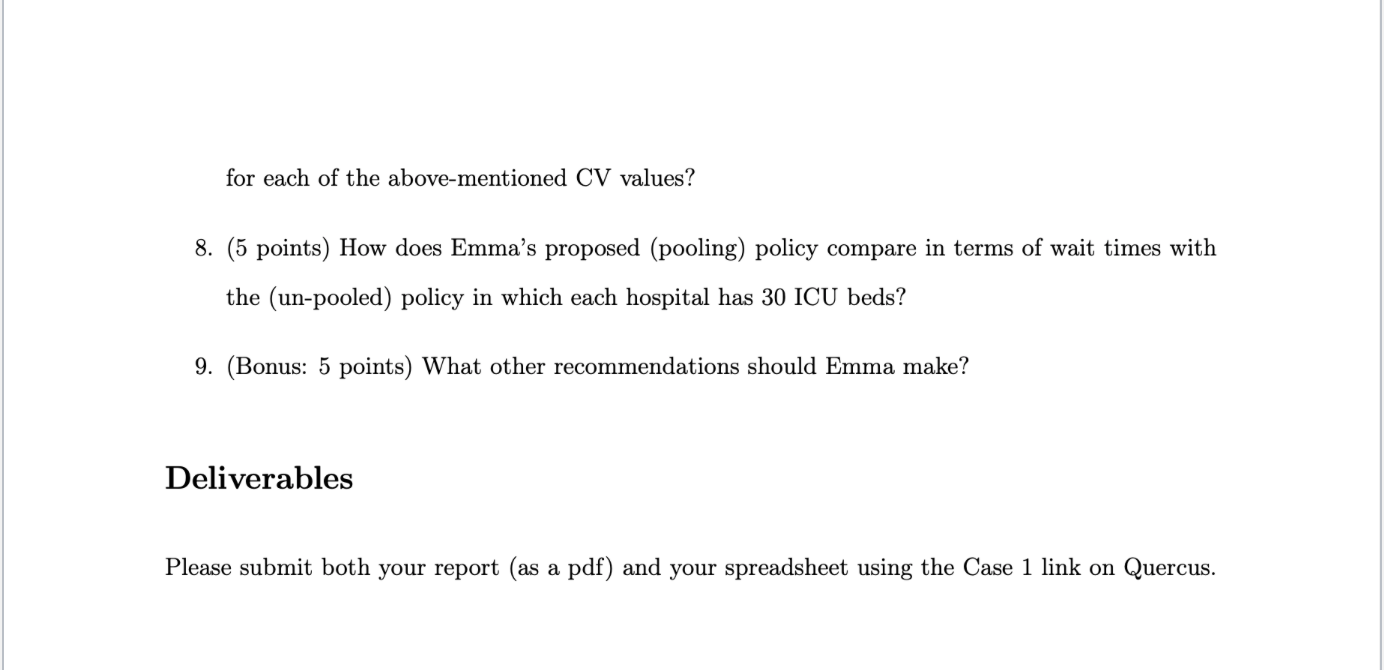
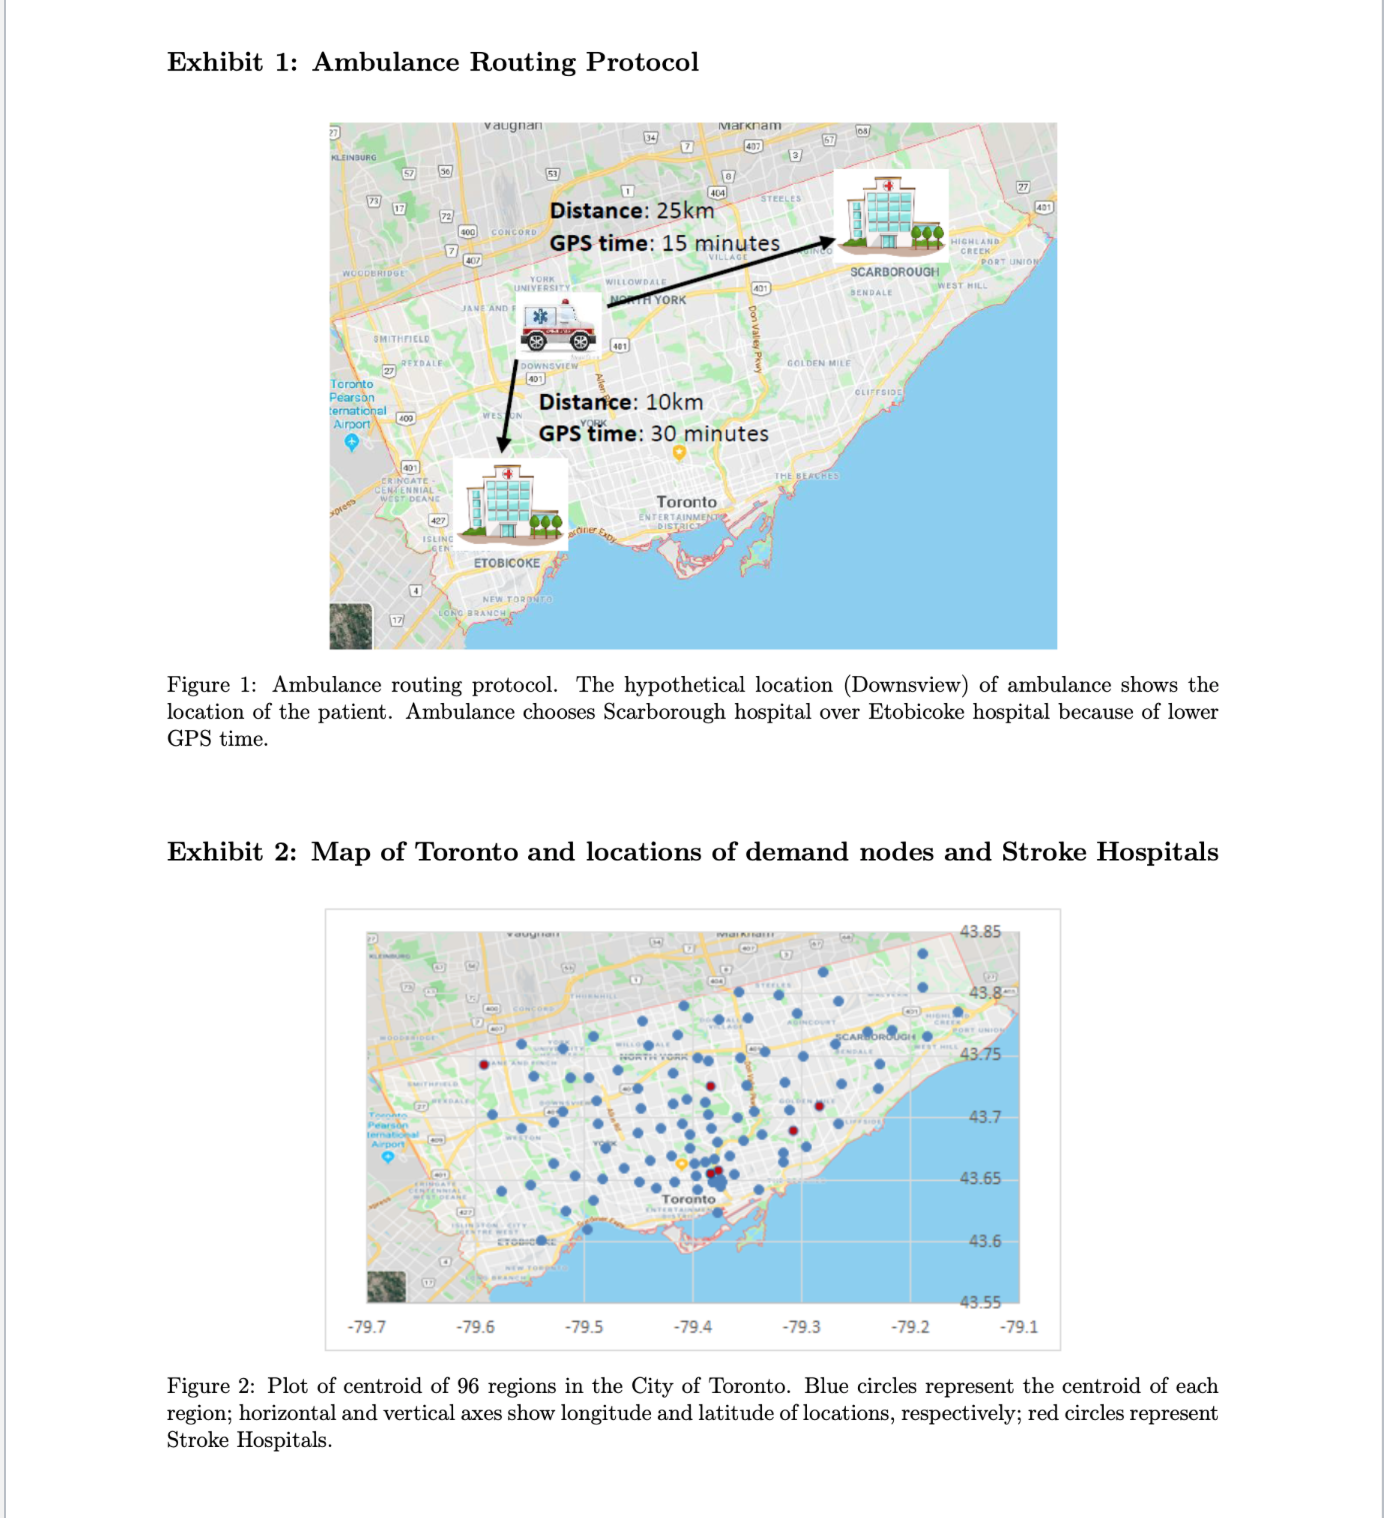

Managing increased demand for ICU beds during the COVID-19 pandemic for the City of Toronto January 18th, 2021 Emma had just finished a meeting with Dr. David Hitchcock, the surgeon-in-chief of the Toronto General Hospital (TGH) and a member of the Operational Excellence team in the Ontario Ministry of Public Health and Long-term Care. Emma spent the last four months working from home. She is still getting used to working from home. The COVID-19 outbreak has changed life for everyone she knows. She has been working for TGH as a healthcare operations expert since July 2016. In May 2020, TGH witnessed a massive increase in the number of patients who visited its Emergency Department (ED), which caused TGH to divert many of its ambulatory patients to other hospitals. Encumbered by such a spike in visits, Dr. Hitchcock summoned the team of operations experts, including Emma, who leads the TGH's internal operations team, to see if they can help reduce the congestion in ICU beds. Dr. Hitchcok appointed Emma to the city-wide Operational Excellence team and asked her to focus on the management of ICU beds for stroke patients. Many of Emma's colleagues are frontline workers who are exposed to excessive stress caused by the pandemic. In addition to the risk of infection, simultaneous provision of health care services to non-COVID-19 patients and COVID-19-infected patients is challenging. Since the outbreak, the hospitals have observed a decrease in patient visits to EDs. As one of Emma's friends puts it, "I prefer to stay home and deal with the pain rather than visiting an ED and getting infected." As sympathetic Emma is to this sentiment, this is too risky for some patients. Specifically, the fear of COVID-19 has increased the number of strokes experienced in Toronto. However, since a stroke is not always self-diagnosable, some patients who have a stroke may delay visiting the ED. As a result, Professors Vahid Roshanaei and Opher Baron, from Rotman School of Management, wrote this case solely to provide material for class discussion. The authors do not intend to illustrate either effective or ineffective handling of a managerial situation. The authors may have disguised certain names and other identifying information to protect con- fidentiality. Any form of reproduction, storage, or transmittal without written permission from the authors is strictly prohibited. Reproduction of this material is not covered under authorization by any reproduction rights organization. To order copies or requests permission to reproduce material please contact vahid.roshanaei@rotman.utoronto.ca.several stroke patients arrived to TGH later than usual.1 Cognizant of this extra demand and the risk to staff and patients, Emma and her team are seeking to accommodate as many ambulatory ICU-requiring patients as possible. Association between COVID-19 and stroke There is growing evidence that people who contract COVIDlQ may have a greater risk of stroke.2 COVID19 is primarily a respiratory disease that can make patients vulnerable to brain injury due to lack of oxygen and blood clots. Since COVID can aect the clotting system, patients, even those with few risk factors for stroke prior to contracting COVIDIQ, are developing a stroke. The quicker you transport the patients to a hospital, the higher is their chance for survival. The advice from the Brain Injury Association of Maryland is to call 911, Emergency Medical Services (EMS), stating that 'you don't want to drive yourself, you don't want someone else to drive you. You want to call 911 because there are things rst responders can do to start the recovery process right in the ambulance.\" Doctors have cautioned against taking stroke symptoms lightly as it is the single leading cause of adult disability. While standard ICU may serve stroke patients, the common practice is to direct stroke patients to Stroke Hospitals. Such hospitals have acute stroke teams, have written case protocols, and provide an integrated EMS. It is medically accepted that the quality of care to stroke patients at stroke hospitals improves patients' outcome, e.g., death rates are reduced by 17% at stroke hospitals. As such, Emma has decided to rst focus on the specialized ICU beds in Stroke Hospitals in Toronto.3 Data and case study for the City of Toronto 50,000-62,000 strokes are observed in Canada each year (Heart&Stroke, 2019). Prompt treatment of stroke is crucial for ensuring better patient outcomes. Emma is well aware of the current ambu lance routing protocol recommended by the BAC for treating acute stroke patients: Dispatch an ambulance to the strokesuspecting patients and transport them as quickly as possible to a Stroke Hospital, La, the Stroke Hospital with the lowest GPS time as illustrated in Exhibit 1. The op- erating rooms in Stroke Hospitals are either staffed 24/7 with neurosurgeons (among many other trained clinicians) or they have oncall neurosurgeons that can perform a surgery within 2 hours of patient arrival. Timely dispatch of ambulances to patients plays a crucial role in supporting early bystander cardiopulmonary resuscitation (CPR) that improves patients' survival. Emma is not convinced that this ambulance routing protocol is suitable in the time of the COVID19 pandemic; she suspects that it may lead to high patient wait times due to excessive congestion in hospital EDs. If deemed practically inefcient, she intends to explore different op- erationally feasible options, including a revision to the routing protocol and/ or the reallocation of resources from one Stroke Hospital to another. To analyze the status quo, she uses the population of Toronto in 2016, i.e., 2,732,139 people; see e.g., Statistics (2019). The City of Toronto in Ontario, depicted in Exhibit 2, is divided into 96 regions. The population of each region is depicted in Exhibit 3. Emma has prepared, in Exhibit 4, the GPS travel time of ambulances from each region to each of the existing six Stroke Hospitals in the City of Toronto. She further assumes the followings: - There were 50,000 stroke patients in Canada in 2019 and the population of Canada is 35 million people. The demand rate for stroke hospitals in each region is equal to the annual number of stroke patients in Canada multiplied by the population of the region divided by the population of Canada. The regional demand rate of stroke patients is depicted in Exhibit 3. - The average GPS travel time for patients in each region to a Stroke Hospital is identical and independent of the time of day. Analysis and policy recommendations Emma thinks that a queueing model could capture the trade-off between ambulance routing proto- cols and the variability (in the service and arrival processes). She needs to provide policies that can improve the status quo as soon as possible. Since over 98% of stroke patients arrive to a hospital via an ambulance, Emma assumes that all stroke patients arrive to stroke hospitals via ambulances. Analysis of the system prior to the pandemic Answer the following questions: 1. 3a. 3b. 5a. (10 points) Use the GPS travel times (Exhibit 4) to nd the regions assigned to each stroke hospital. What is the (stroke) patient arrival rate of each stroke hospital, A, in patients per year? Assume that currently each stroke hospital is allocated 30 beds and that the average ow time of stroke patients in ICU beds, i.e., 1/\policy compare with the total number of beds under the policy that allocates 30 ICU beds to each stroke hospital? 5b. (5 points) What would be the average wait time (in minutes) in each hospital under the bed allocation policy proposed in Question 5a? 6. (15 points) What is the minimum number of beds that you should allocate to each stroke hospital to ensure that the average wait time of each stroke hospitals is less than or equal to 9 minutes? Analysis of the system after the pandemic Emma wishes to e'ectively manage the increased ICU bed demand for stroke patients caused by the pandemic. She considers an increase of 15% in demand for ICU beds from stroke patients; This increase is equivalent to having 57,500 stroke patients a year in Canada. Emma uses this increase as a proxy for unprecedented surge in demand for ICU beds in Stroke Hospitals, due to the pandemic. Having conducted thorough investigation regarding congestion in stroke ICU beds in hospitals in Toronto, Emma and her team brought to the attention of Dr. Hitchcock that transporting stroke patients to the nearest hospital based on the GPS travel times may result in heavy congestion in some hospitals. Emma is contemplating another ambulance routing protocol. She believes given the stateoftheart technology, Stroke Hospitals can communicate with the EMS personnel during the transportation of a stroke patient. She believes real-time coordination between the EMS and the ED personnel would lead to equal workload distribution among the stroke hospitals, because the ambulances no longer require to transport the stroke patients to the nearest hospital. This fully coordinated system is analogous to one pooled hospital with 180 beds. Emma shared her idea with her friend, Barak (who took this course last year). Barak believes that such an policy may increase the variability in the arrival of stroke patients to the hospitals. To test if her approach is preferable to the current practice (even if the variation in arrivals may increase), Emma wishes to analyze the suggested system while varying the CV of the stroke patient arrivals between 1 and 2 (in increments of 0.2). 7. (10 points) What is the average wait time (in minutes) of stroke patients in the pooled system for each of the above-mentioned CV values? 8. (5 points) How does Emma's proposed (pooling) policy compare in terms of wait times with the (un-pooled) policy in which each hospital has 30 ICU beds? 9. (Bonus: 5 points) What other recommendations should Emma make? Deliverables Please submit both your report (as a pdf) and your spreadsheet using the Case 1 link on Quercus.Exhibit 1: Ambulance Routing Protocol lot'l we". 1; '..J$ \\ be . Figure l: Ambulance routing protocol. The hypothetical location (Dosmsview) of ambulance shows the location of the patient. Ambulance chooses Scarborough hospital over Etobioolce hospital because of lower GPS time. Exhibit 2: Map of Toronto and locations of demand nodes and Stroke Hospitals Figure 2: Plot of centroid of 96 regions in the City of Toronto. Blue circles represent the centroid of each region; horizontal and vertical axes show longitude and latitude of locations, respectively; red circles represent Stroke Hospitals. Exhibit 3: Regional demand rate for Stroke Patients in the City of Toronto Geographic name Population, 2016 Regional demand rate Geographic name Population, 2016 Regional demand rate M1B 66108 94 M4T 10463 15 MIC 35626 51 M4V 18241 M1E 46943 67 M4W 14561 M1G 29690 42 M4X 20822 M1H 24383 35 MAY 30472 44 M1 36699 52 MSA 4107 MIK 48434 69 M5B 12785 18 MIL 35081 50 MSC 2951 MIM 22913 33 MSE 9118 32 MSG 8423 MIN 22136 M1P 45571 MSH 2005 MIR 29858 M5J 14545 Mis 37769 MSM 25975 MIT 34588 MSN 16610 MIV 54680 MSP 19423 MIw 48471 MSR 26496 MIX 15097 MSS 15372 M2H 24497 MST 17748 M21 58293 MSV 49195 M2 K 23852 MGA 21048 M2 11717 M6B 28522 M2M 32320 MGC 24596 M2N 75897 108 MGE 38041 M2 7843 M6G 2086 M2F 40792 MGH 4950 M3A 34615 M6J 32684 M38 13324 M6K 40957 M3C 39153 M6L 20616 M3H 37011 MGM 42434 M3. 25473 M6N 41243 M3 1 5997 M6P 40035 M31 17339 M6R 19857 M3M 24046 M6S 34299 M3N 41958 M8V 37975 MAA 14443 M8W 20674 M4B 18628 M8X 10787 M40 4686 MBY 21299 MAE 25044 M8Z 17038 MAG 1907 M9A 35594 MAH 1968 28 M9B 32400 M4 35738 51 M9C 38291 MAK 31583 M9L 11950 M4L 32640 M9M 22263 MAM 24689 MON 25074 MAN 15330 M9P 20874 MAP 20039 M9R 33743 M4R 11394 M9V 55959 M4 26506 M9W 40684 Figure 3: Population for each region of the City of Toronto; the population of Toronto was 2,732, 139 in 2016.Exhibit 4: GPS travel times from each region to each Stroke Hospital MSVIRE MACJET MSG1X5 MAN3M5 MILIW1 N MAN3MS MILTW1 MSG Figure 4: Travel time (in minutes) from the centroid of each region to the centroid of each stroke hospitals in Toronto. Emma obtained GPS travel times from Google map as the average of the best and worst travel times at lam. This is almost traffic-free time in Toronto as Ambulances are less affected by traffic. Exhibit 5: Formulas required to solve the case 1. Utilization T = Ex/ 2. Average number of people in a pooled queue: I. ~ TV2(c+1) C2+C? 3. Average wait time in system: To = (Little's law)
Step by Step Solution
There are 3 Steps involved in it

Get step-by-step solutions from verified subject matter experts