

Question: Please help me with this data analysis this experiment is the analysis of quinine by fluorescence spectrometry 1. Plot the fluorescence intensity vs. the quinine
Please help me with this data analysis 
this experiment is the analysis of quinine by fluorescence spectrometry
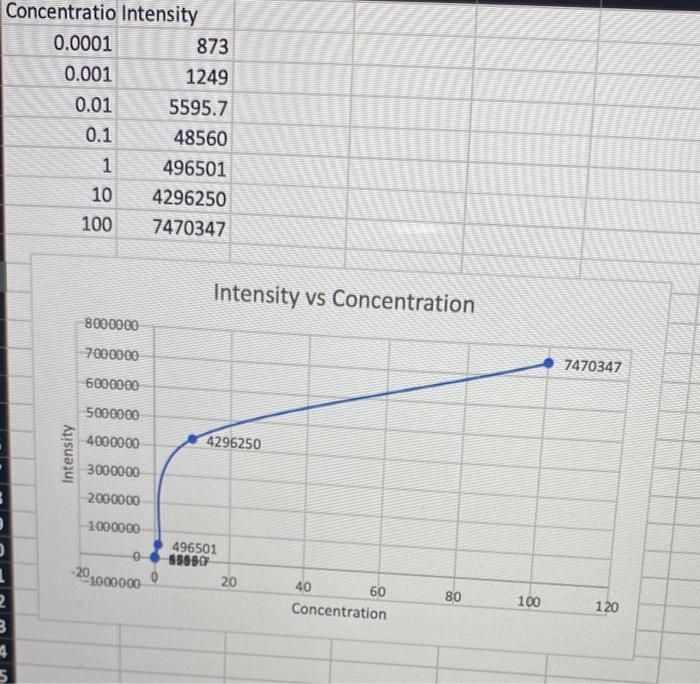
1. Plot the fluorescence intensity vs. the quinine concentration of the standards logarithmically (a log-log plot). Determine and report the linear dynamic range (LDR) of the experiment. This is often reported as the highest concentration divided by the lowest and expressed as 10. Report the upper limit of quantitation (ULOQ) as the highest concentration of the LDR. You may estimate these by interpolating between points. Normally, the calibration curve flattens out below the lower limit of quantitation (LLOQ) and above the ULOQ. Intensitv vs Concontrotion
Step by Step Solution
There are 3 Steps involved in it
1 Expert Approved Answer
Step: 1 Unlock

Question Has Been Solved by an Expert!
Get step-by-step solutions from verified subject matter experts
Step: 2 Unlock
Step: 3 Unlock