

Question: Please help me with this i domt understand Question Completion Status 21 9 TO Presented below is selected data from the financial statements of Vert,
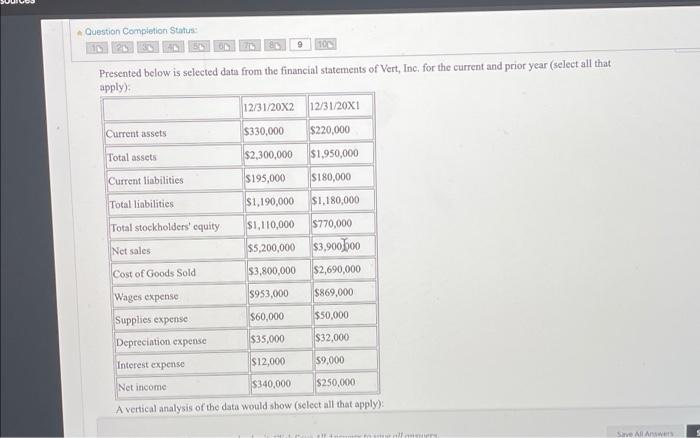
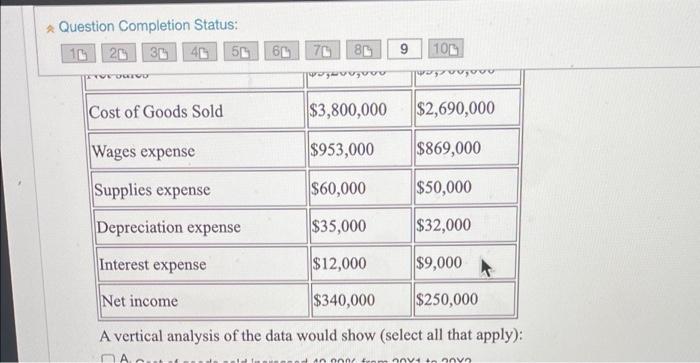
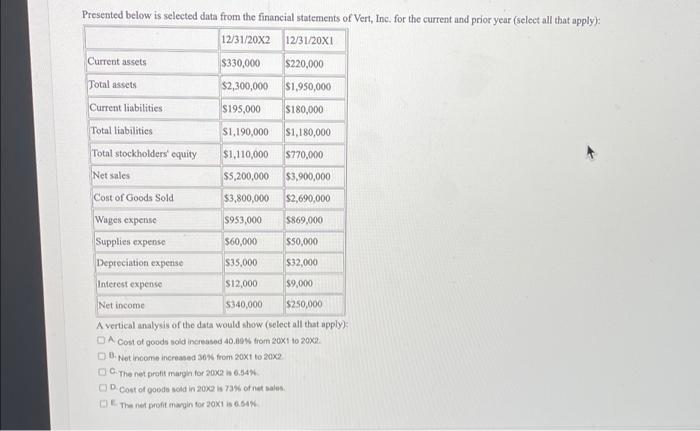
Question Completion Status 21 9 TO Presented below is selected data from the financial statements of Vert, Inc. for the current and prior year (select all that apply) 12/31/20X2 12/31/20X1 Current assets $330.000 $220,000 Total assets $2,300,000 $1,950,000 Current liabilities $195,000 $180,000 Total liabilities $1,190,000 $1,180,000 Total stockholders' cquity $1,110,000 5770,000 Net sales $5,200,000 $3,900 hoo Cost of Goods Sold $3,800,000 $2,690,000 953,000 $869,000 Wages expense Supplies expense Depreciation expense $60,000 $50,000 $35,000 $32,000 Interest expense $12,000 59,000 $250,000 Net income $340,000 A vertical analysis of the data would show (select all that apply): Save All Answers Question Completion Status: 15 20 30 56 60 70 86 9 100 wwwvuguvu wowo Cost of Goods Sold $3,800,000 $2,690,000 Wages expense $953,000 $869,000 Supplies expense $60,000 $50,000 Depreciation expense $35,000 $32,000 Interest expense $12,000 $9,000 Net income $340,000 $250,000 A vertical analysis of the data would show (select all that apply): . Anon AVVO Presented below is selected data from the financial statements of Vert, Inc. for the current and prior year (select all that apply): 12/31/20X2 12/31/20X1 Current assets $330,000 $220,000 Total assets $2,300,000 $1,950,000 Current liabilities $195,000 $180,000 Total liabilities $1,190,000 $1,180,000 Total stockholders' equity $1,110,000 $770,000 Net sales $5,200,000 $3,900,000 Cost of Goods Sold $3,800,000 $2,690,000 Wages expense $953,000 $869,000 Supplies expense $60,000 $50,000 Depreciation expense $35,000 $32,000 Interest expense $12,000 $9,000 Net income $340,000 $250,000 A vertical analysis of the data would show (select all that apply) DA Cost of goods sold increased 40.00% from 20x1 to 20x2. B.Net Income increme 30% from 20x1 to 20x2. OG. The net profit margin for 20x2 16.54 OD. Cost of goods sold in 20X2 is 73% of net sales The ner profit margin for 201 is 6.54%
Step by Step Solution
There are 3 Steps involved in it

Get step-by-step solutions from verified subject matter experts