

Question: Please help me with this microeconomics homework :) it has to be written in a paragraph essay from :) Thank you! The graph below depicts
Please help me with this microeconomics homework :) it has to be written in a paragraph essay from :) Thank you!
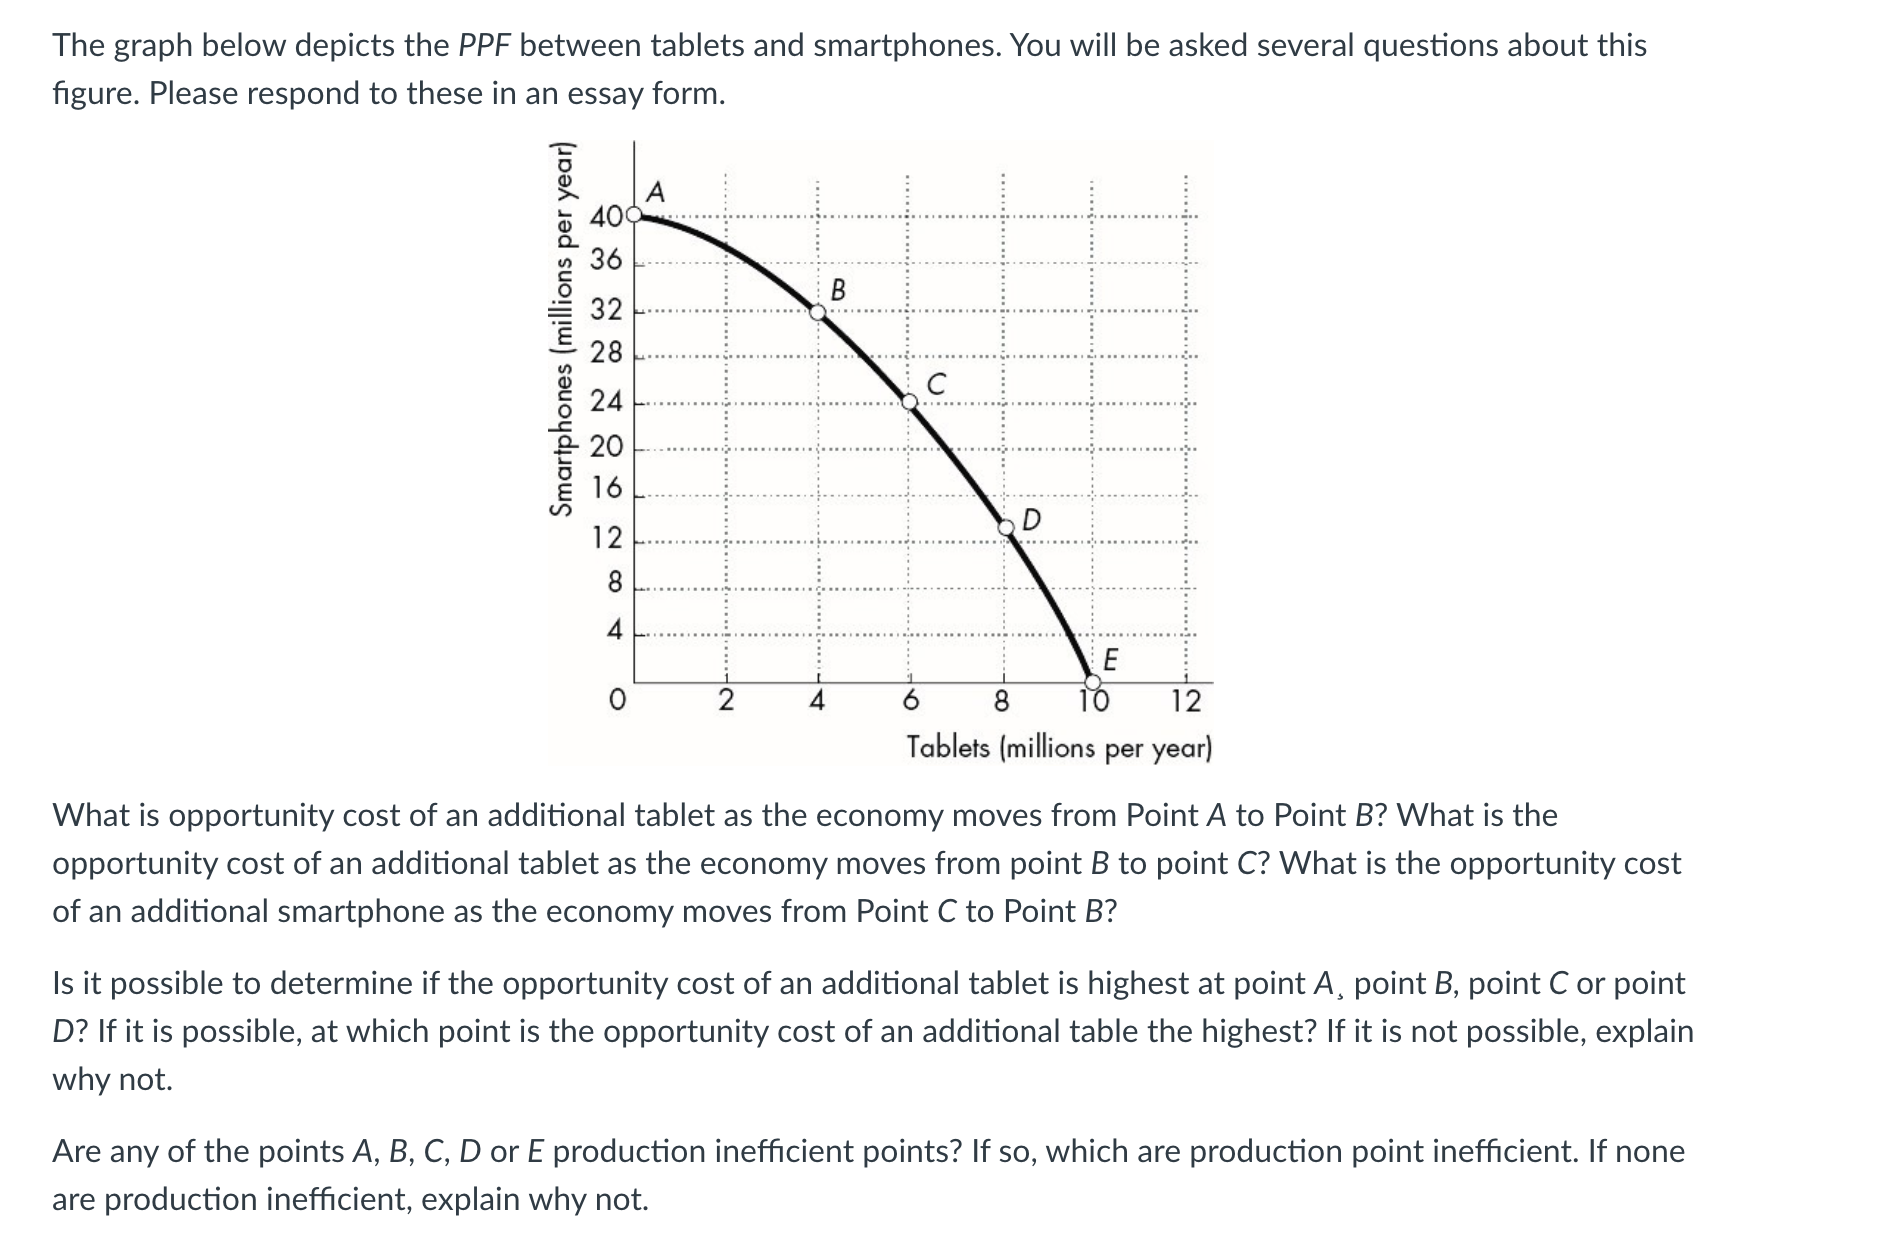
The graph below depicts the PPF between tablets and smartphones. You will be asked several questions about this figure. Please respond to these in an essay form. .. ... .. ....... . ........... . . !.. . . .......................... P . . . .. . . ...." Smartphones (millions per year) . . . .i. ... ...... C . .. .. - . . .. .. . ... D . . .. . . . ... ...... E O 8 10 12 Tablets (millions per year) What is opportunity cost of an additional tablet as the economy moves from Point A to Point B? What is the opportunity cost of an additional tablet as the economy moves from point B to point C? What is the opportunity cost of an additional smartphone as the economy moves from Point C to Point B? Is it possible to determine if the opportunity cost of an additional tablet is highest at point A, point B, point C or point D? If it is possible, at which point is the opportunity cost of an additional table the highest? If it is not possible, explain why not. Are any of the points A, B, C, D or E production inefficient points? If so, which are production point inefficient. If none are production inefficient, explain why not
Step by Step Solution
There are 3 Steps involved in it

Get step-by-step solutions from verified subject matter experts