

Question: Please help me with this problem. Background: We have covered how to use pandas and matplotlib. Your task for this lab is to analyze a
Please help me with this problem.
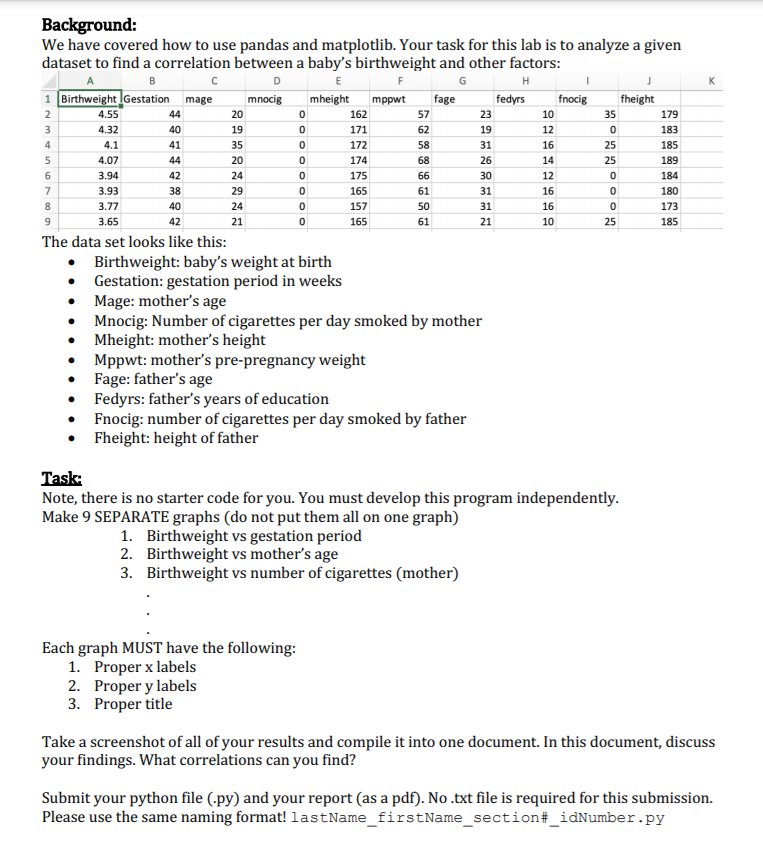
Background: We have covered how to use pandas and matplotlib. Your task for this lab is to analyze a given dataset to find a correlation between a baby's birthweight and other factors: D E H 1 Birthweight Gestation mage mnocig mheight mppwt fage fedyrs fnocig fheight 2 4.55 44 20 162 57 25 10 179 4.32 10 19 171 62 19 12 0 183 4.1 41 35 0 172 58 31 16 25 185 4.07 44 20 174 68 26 14 25 189 3.94 42 24 175 66 30 12 184 3.93 3.8 29 165 61 31 16 o 180 40 157 50 31 16 CO 3.77 24 173 3.65 21 165 61 21 10 25 185 The data set looks like this: Birthweight: baby's weight at birth Gestation: gestation period in weeks Mage: mother's age Mnocig: Number of cigarettes per day smoked by mother Mheight: mother's height Mppwt: mother's pre-pregnancy weight Fage: father's age Fedyrs: father's years of education Fnocig: number of cigarettes per day smoked by father Fheight: height of father Task: Note, there is no starter code for you. You must develop this program independently. Make 9 SEPARATE graphs (do not put them all on one graph) 1. Birthweight vs gestation period 2. Birthweight vs mother's age 3. Birthweight vs number of cigarettes (mother) Each graph MUST have the following: 1. Proper x labels 2. Proper y labels 3. Proper title Take a screenshot of all of your results and compile it into one document. In this document, discuss your findings. What correlations can you find? Submit your python file (.py) and your report (as a pdf). No .txt file is required for this submission. Please use the same naming format! lastName_firstName_section#_idNumber . py
Step by Step Solution
There are 3 Steps involved in it

Get step-by-step solutions from verified subject matter experts