

Question: Please help me with this problem! Waterfall charts draw attention to factors that cause differences between amounts, such as the increase in a company's net
Please help me with this problem! 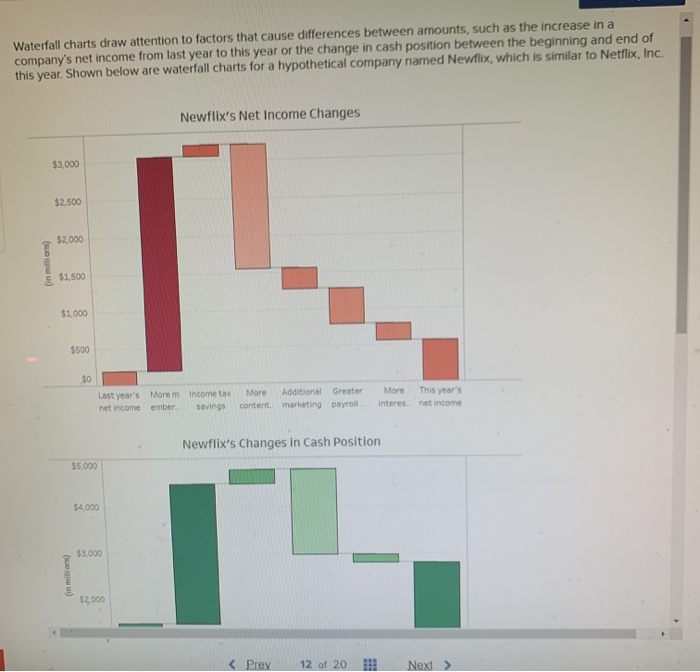
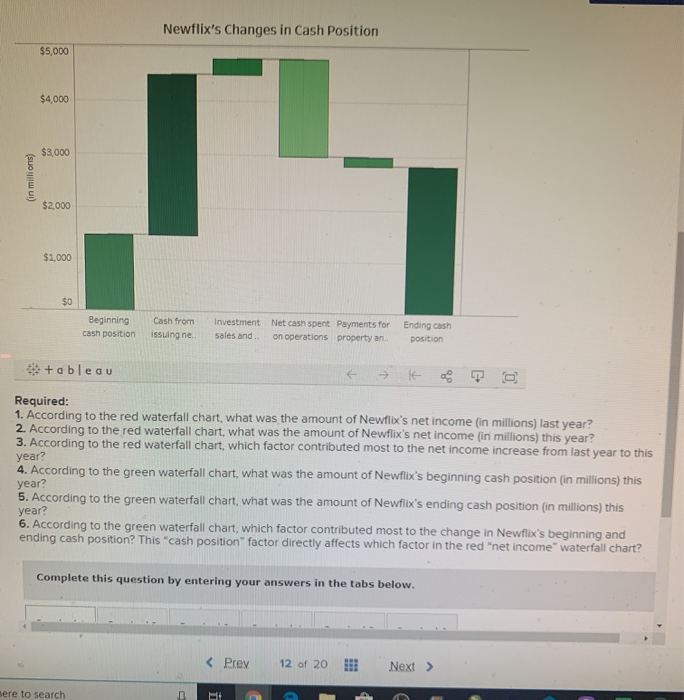
Waterfall charts draw attention to factors that cause differences between amounts, such as the increase in a company's net income from last year to this year or the change in cash position between the beginning and end of this year. Shown below are waterfall charts for a hypothetical company named Newflix, which is similar to Netflix, Inc. Newflix's Net Income Changes $3,000 $2,500 $2,000 inmond $1.500 $1,000 $500 Last year's Morem net incomember income tax savings More Additional content marketing Greater payroll More interes This year's net income Newflix's Changes in Cash Position $5.000 $4.000 (in million) $2.000
Step by Step Solution
There are 3 Steps involved in it
1 Expert Approved Answer
Step: 1 Unlock

Question Has Been Solved by an Expert!
Get step-by-step solutions from verified subject matter experts
Step: 2 Unlock
Step: 3 Unlock