

Question: Please help me with this Question 1 (a) and (b). Thank you. Need Clear and Brief Explanations and answers. Question 1 a) A manufacturing company
Please help me with this Question 1 (a) and (b). Thank you.
Need Clear and Brief Explanations and answers.
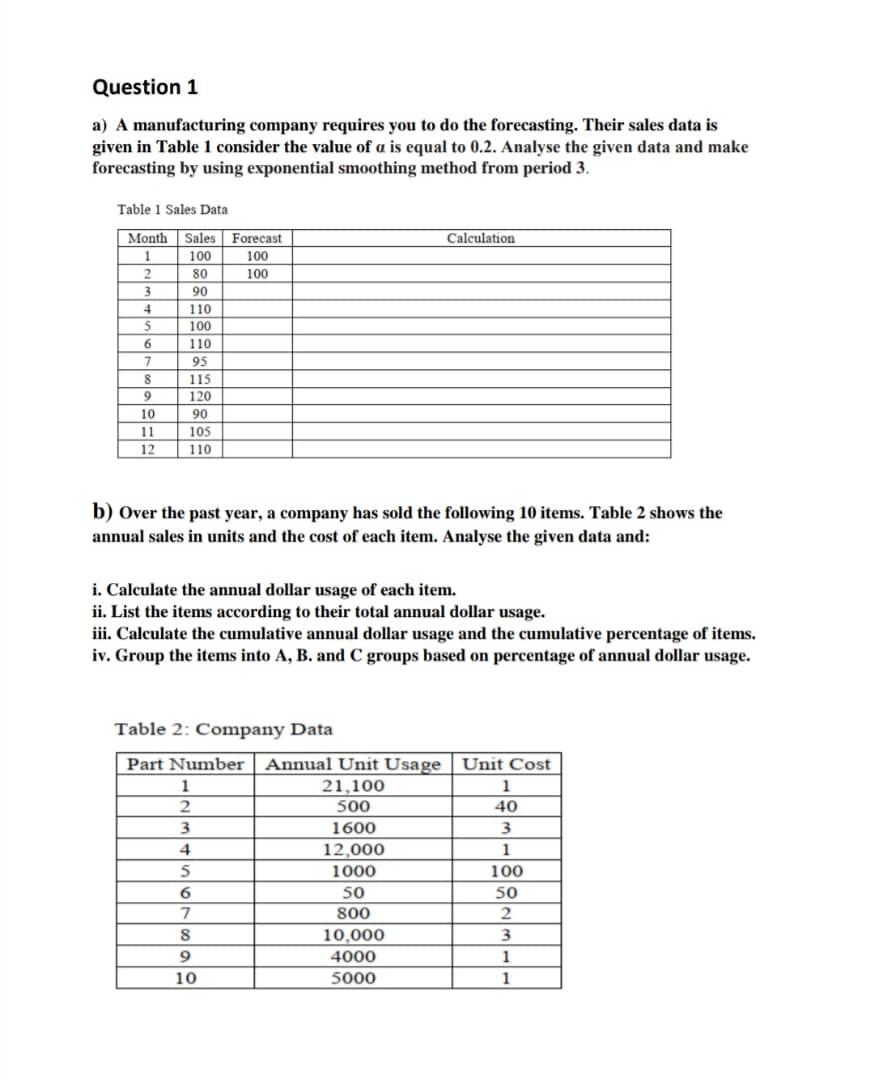
Question 1 a) A manufacturing company requires you to do the forecasting. Their sales data is given in Table 1 consider the value of a is equal to 0.2. Analyse the given data and make forecasting by using exponential smoothing method from period 3. Table 1 Sales Data Calculation Month 1 2 3 4 S 6 7 8 9 10 11 12 Sales Forecast 100 100 80 100 90 110 100 110 95 115 120 90 105 110 b) Over the past year, a company has sold the following 10 items. Table 2 shows the annual sales in units and the cost of each item. Analyse the given data and: i. Calculate the annual dollar usage of each item. ii. List the items according to their total annual dollar usage. iii. Calculate the cumulative annual dollar usage and the cumulative percentage of items. iv. Group the items into A, B. and C groups based on percentage of annual dollar usage. Table 2: Company Data Part Number Annual Unit Usage Unit Cost 1 21.100 1 2 500 40 3 1600 3 4 12,000 1 5 1000 100 6 SO so 7 800 2 8 10,000 3 9 4000 1 10 5000 1Step by Step Solution
There are 3 Steps involved in it
1 Expert Approved Answer
Step: 1 Unlock

Question Has Been Solved by an Expert!
Get step-by-step solutions from verified subject matter experts
Step: 2 Unlock
Step: 3 Unlock