

Question: PLEASE HELP ME. WITH THIS Question 5 Path Difference Not yet answered Type of (Number of Marked out of Number Interference Wavelengths) 5.00 - Flag

PLEASE HELP ME. WITH THIS
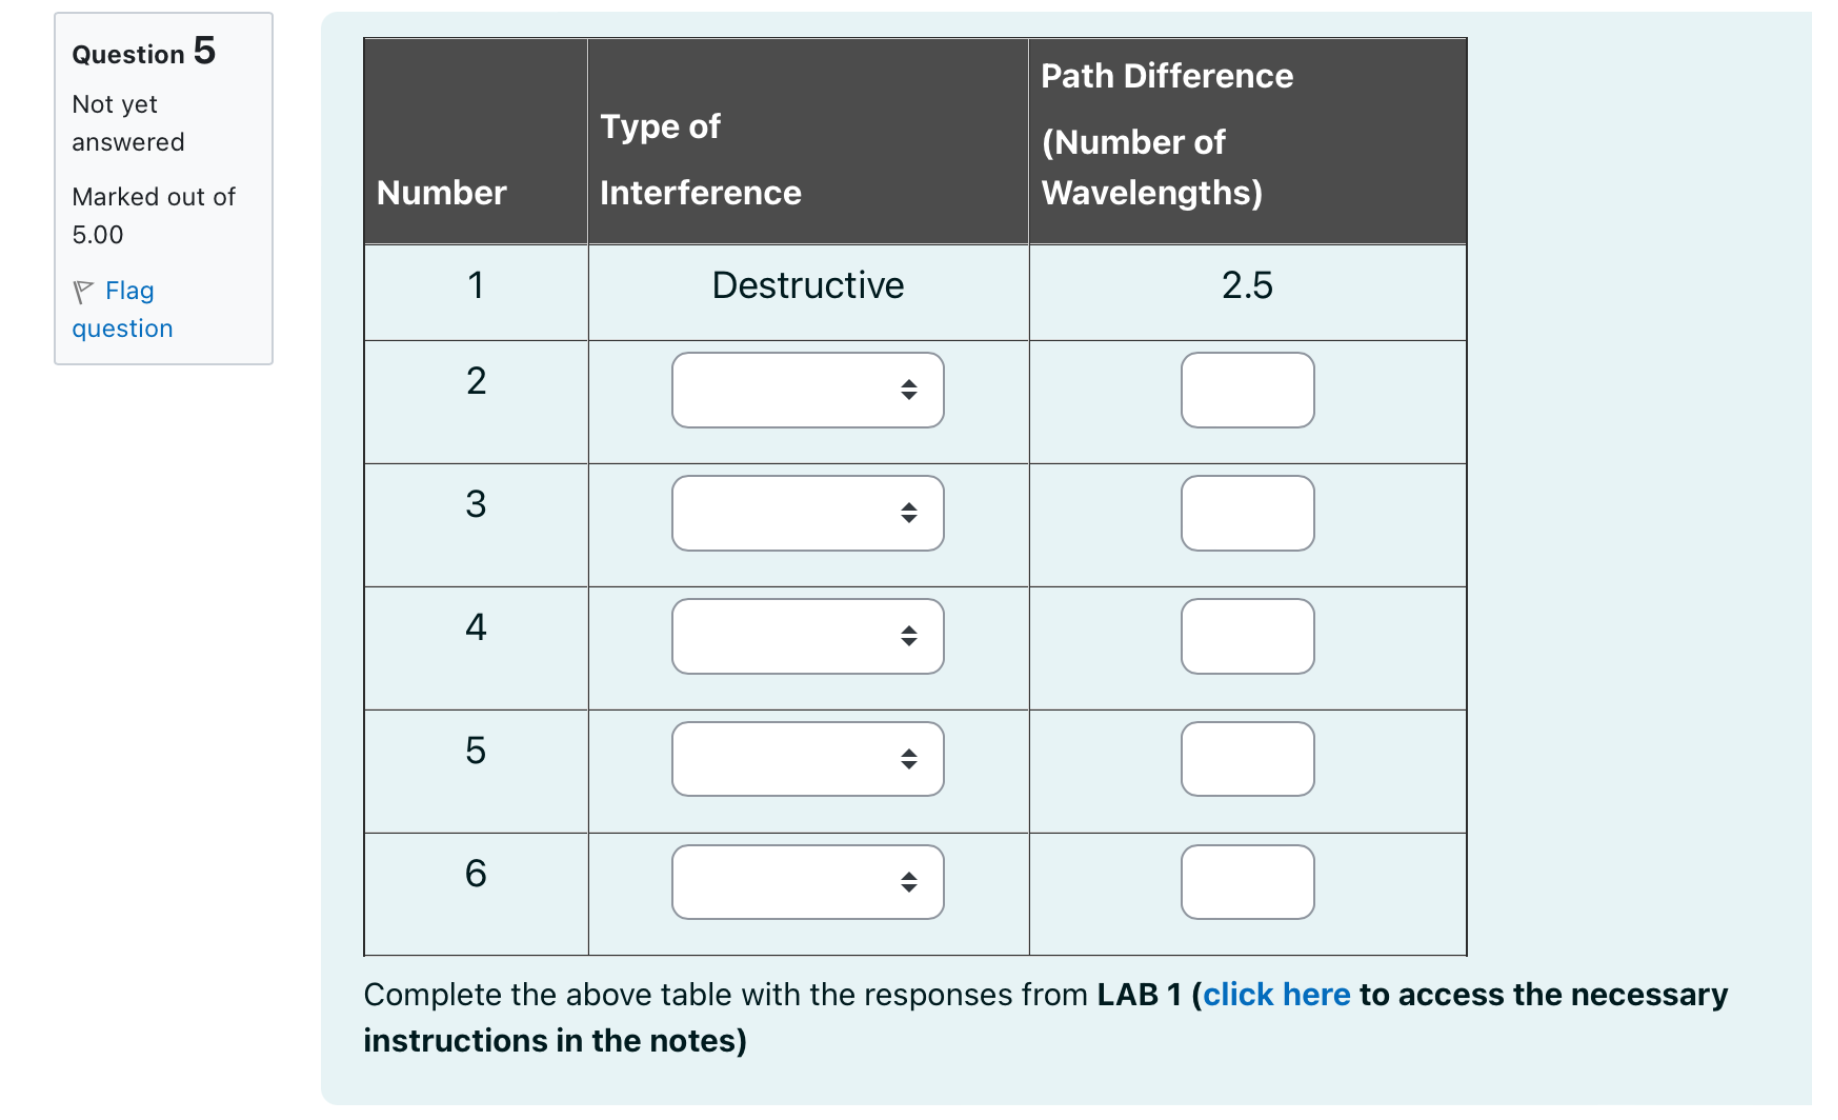
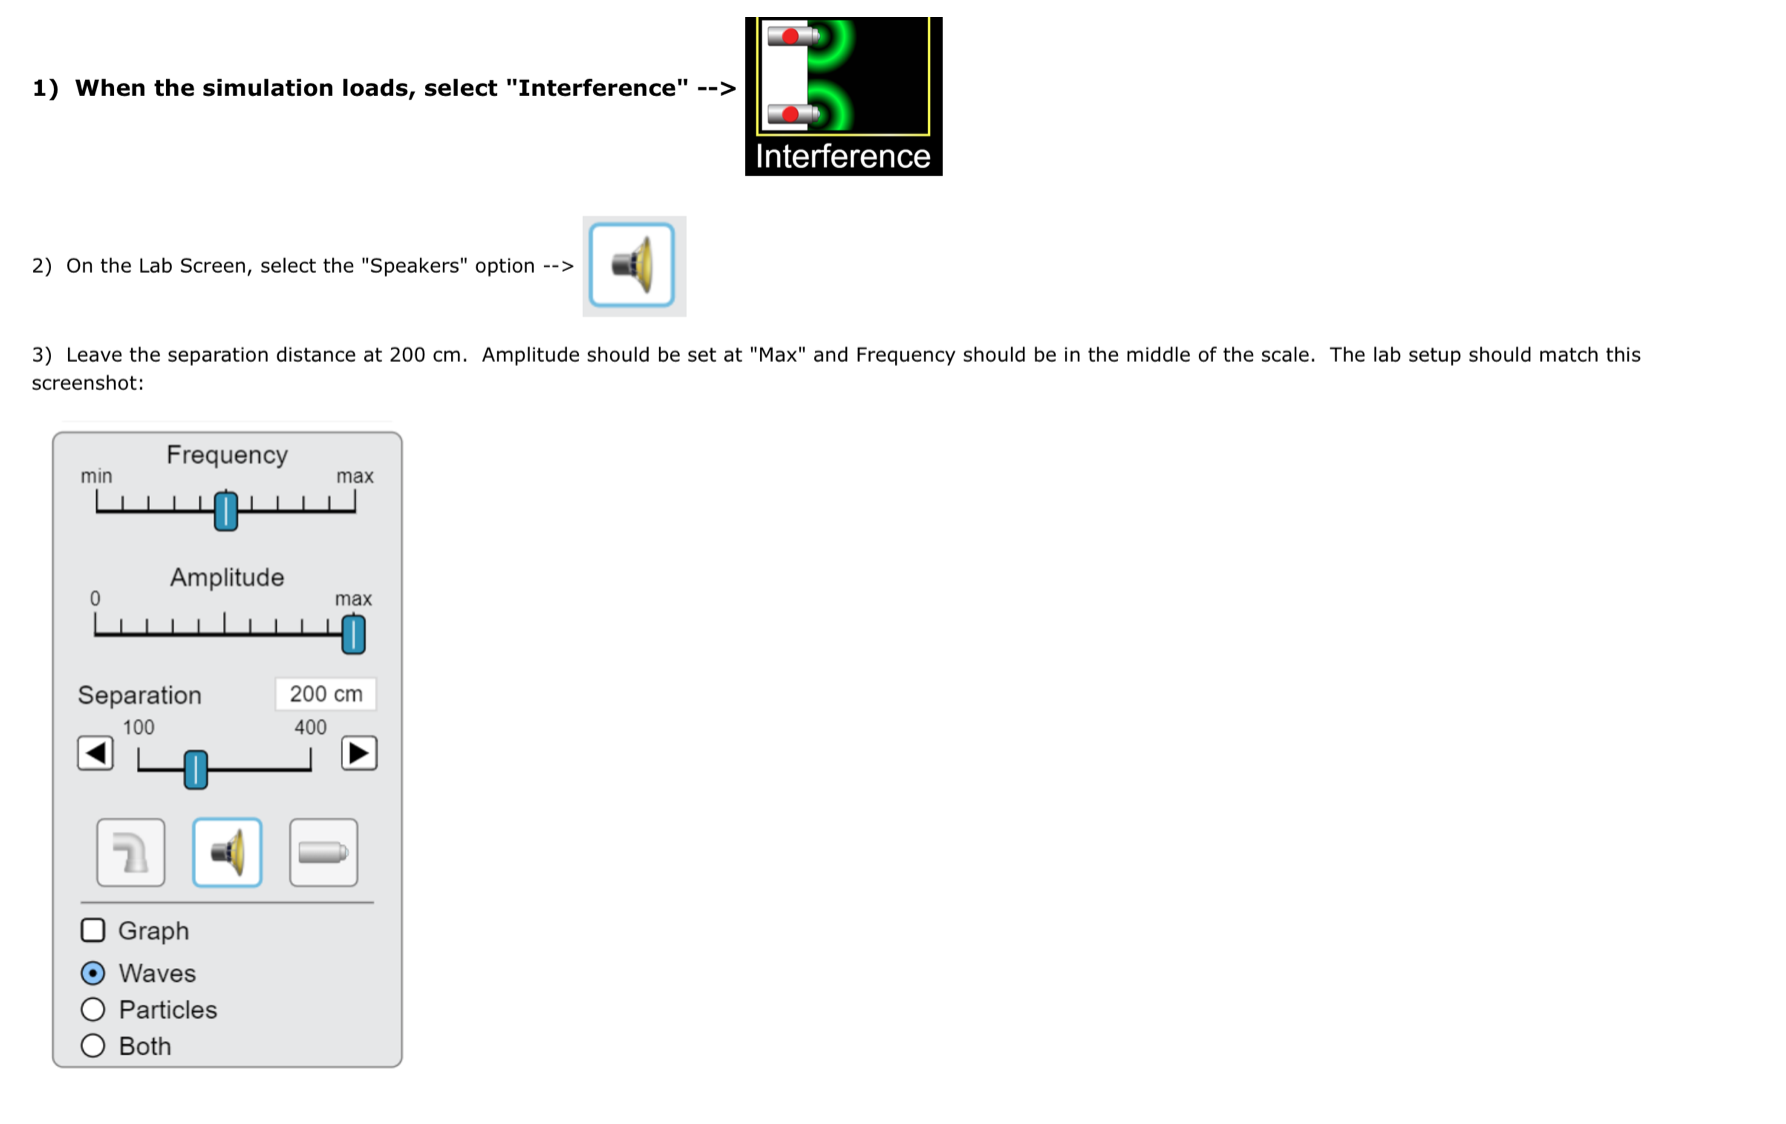


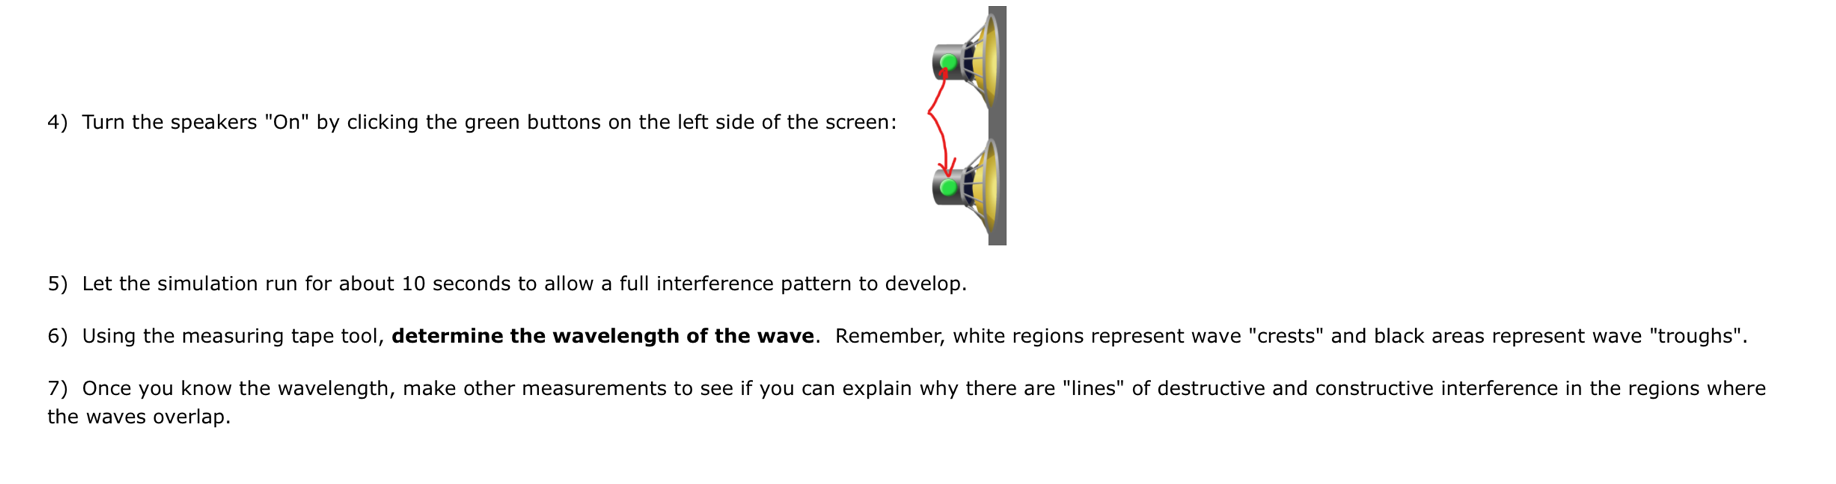
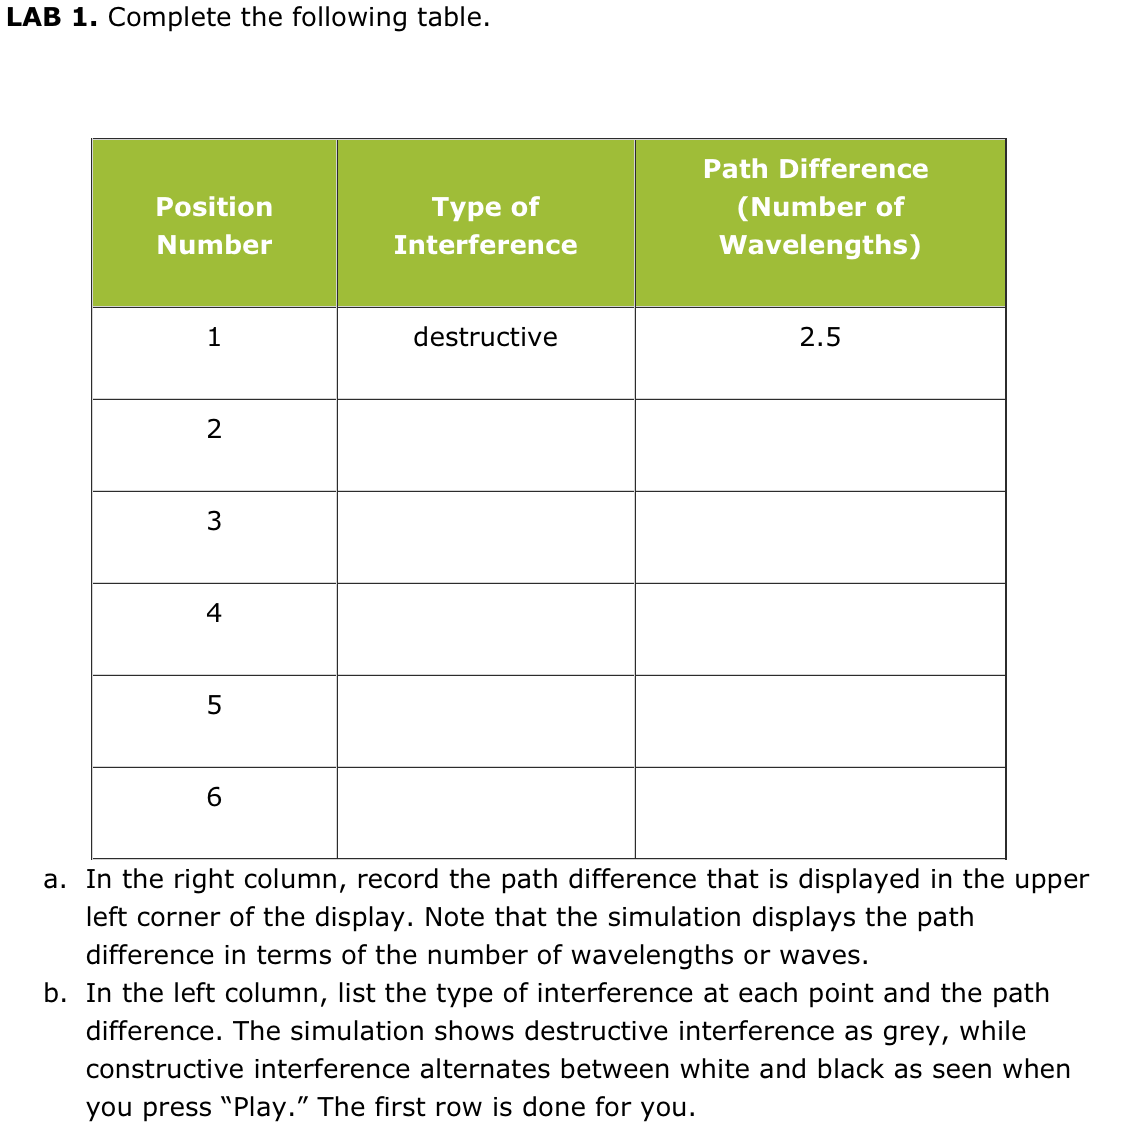
Question 5 Path Difference Not yet answered Type of (Number of Marked out of Number Interference Wavelengths) 5.00 - Flag Destructive 2.5 question 2 3 4 5 6 Complete the above table with the responses from LAB 1 (click here to access the necessary instructions in the notes)1) When the simulation loads, select "Interference" --> Interference 2) On the Lab Screen, select the "Speakers" option --> 3) Leave the separation distance at 200 cm. Amplitude should be set at "Max" and Frequency should be in the middle of the scale. The lab setup should match this screenshot: Frequency min max Amplitude max Separation 200 cm 100 400 O Graph Waves O Particles O Both4) Turn the speakers "On" by clicking the green buttons on the left side of the screen: 5) Let the simulation run for about 10 seconds to allow a full interference pattern to develop. 6) Using the measuring tape tool, determine the wavelength of the wave. Remember, white regions represent wave "crests" and black areas represent wave "troughs". 7) Once you know the wavelength, make other measurements to see if you can explain why there are "lines" of destructive and constructive interference in the regions where the waves overlap.LAB 1. Complete the following table. Path Difference Position Type of ( Number of Number Interference Wavelengths) destructive 2.5 2 W 4 5 6 a. In the right column, record the path difference that is displayed in the upper left corner of the display. Note that the simulation displays the path difference in terms of the number of wavelengths or waves. b. In the left column, list the type of interference at each point and the path difference. The simulation shows destructive interference as grey, while constructive interference alternates between white and black as seen when you press "Play." The first row is done for you
Step by Step Solution
There are 3 Steps involved in it

Get step-by-step solutions from verified subject matter experts