

Question: Please help me with this question as soon as possible. Thank you so much! Question 1: Assume that the growth rate for real GDP between
Please help me with this question as soon as possible. Thank you so much!
Question 1:
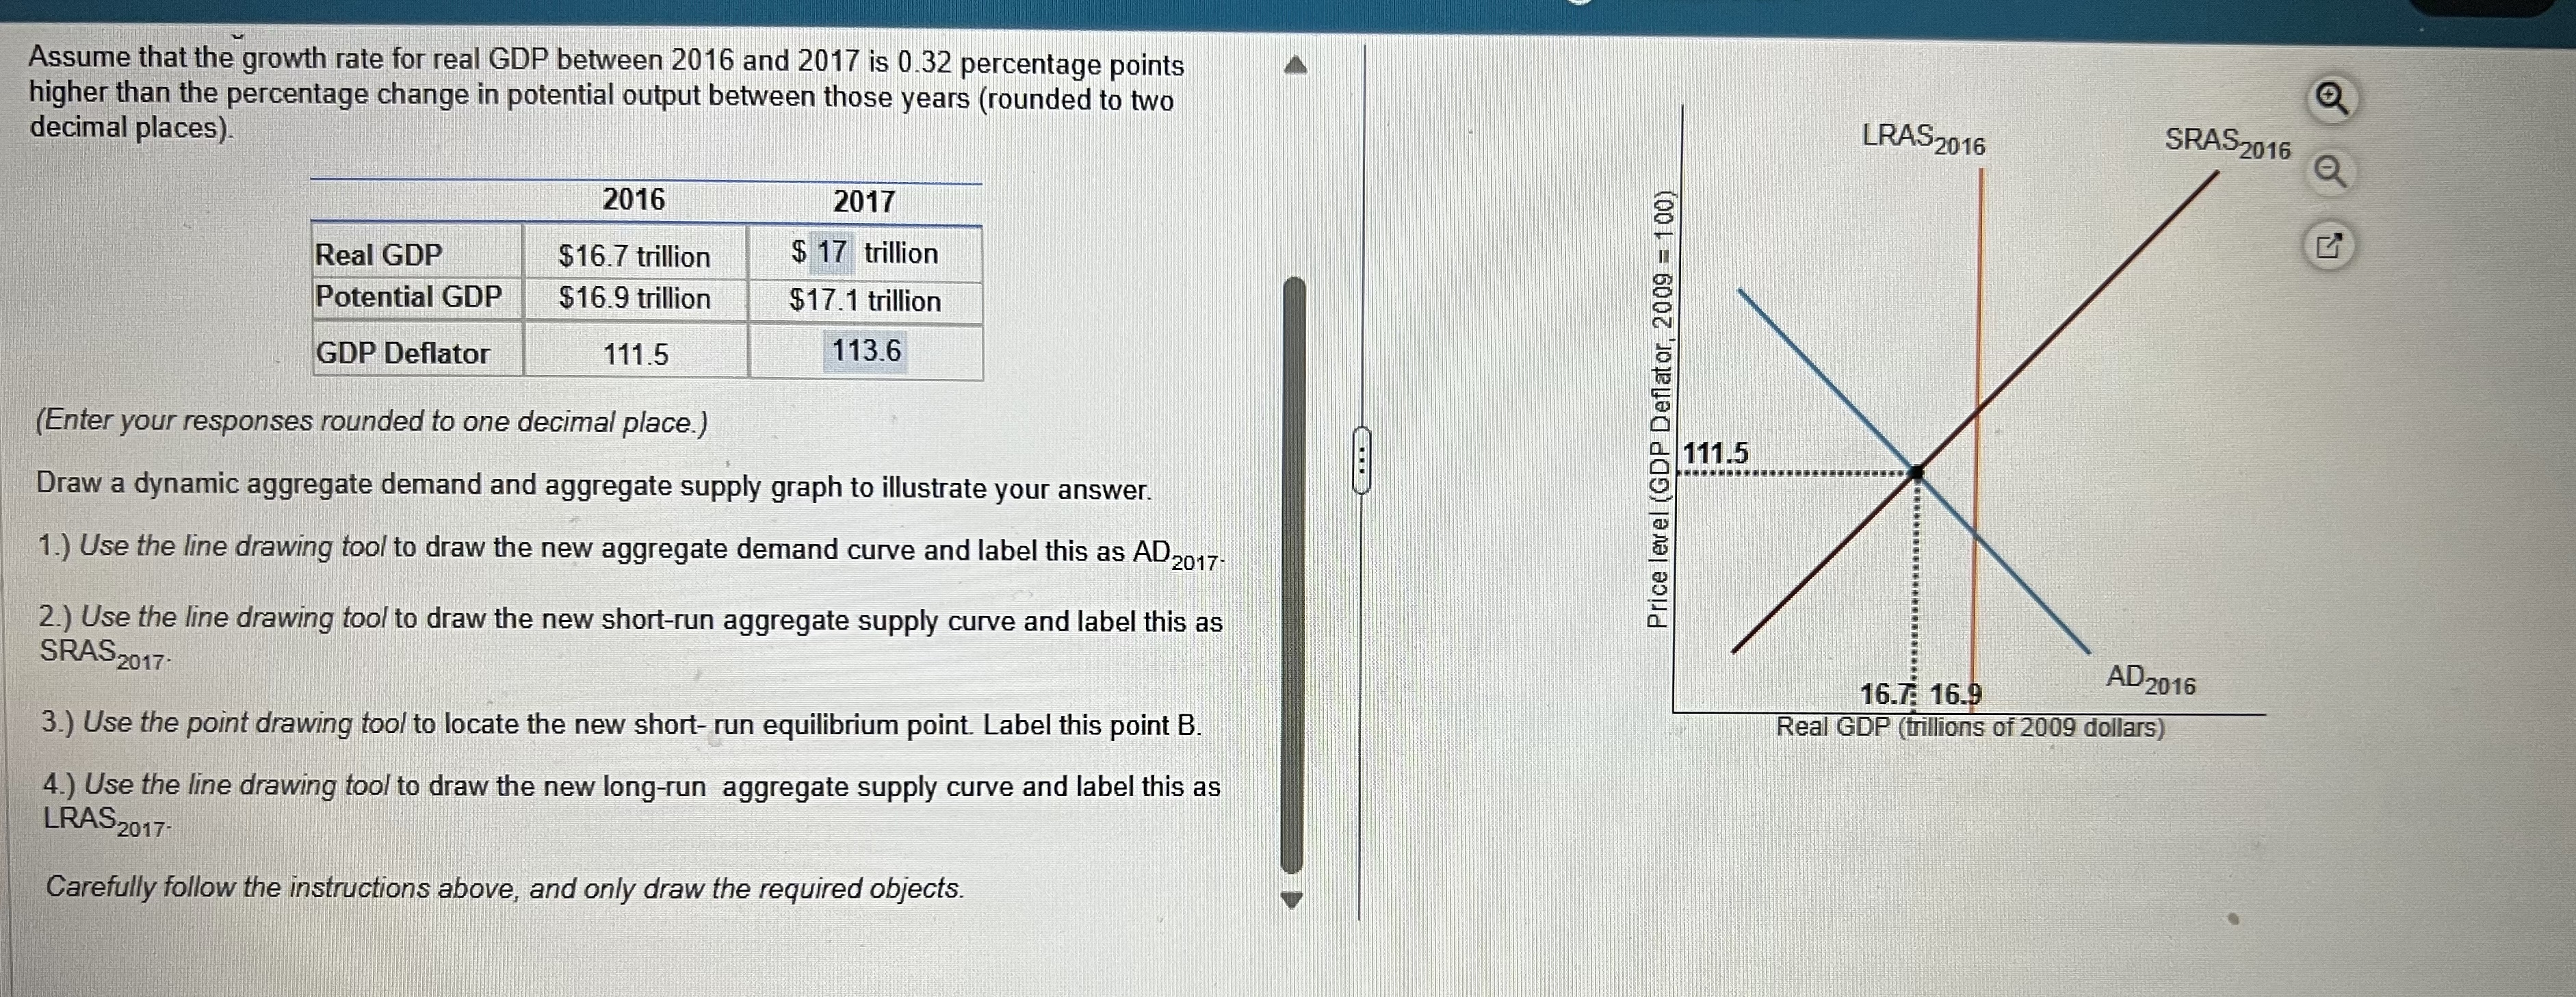
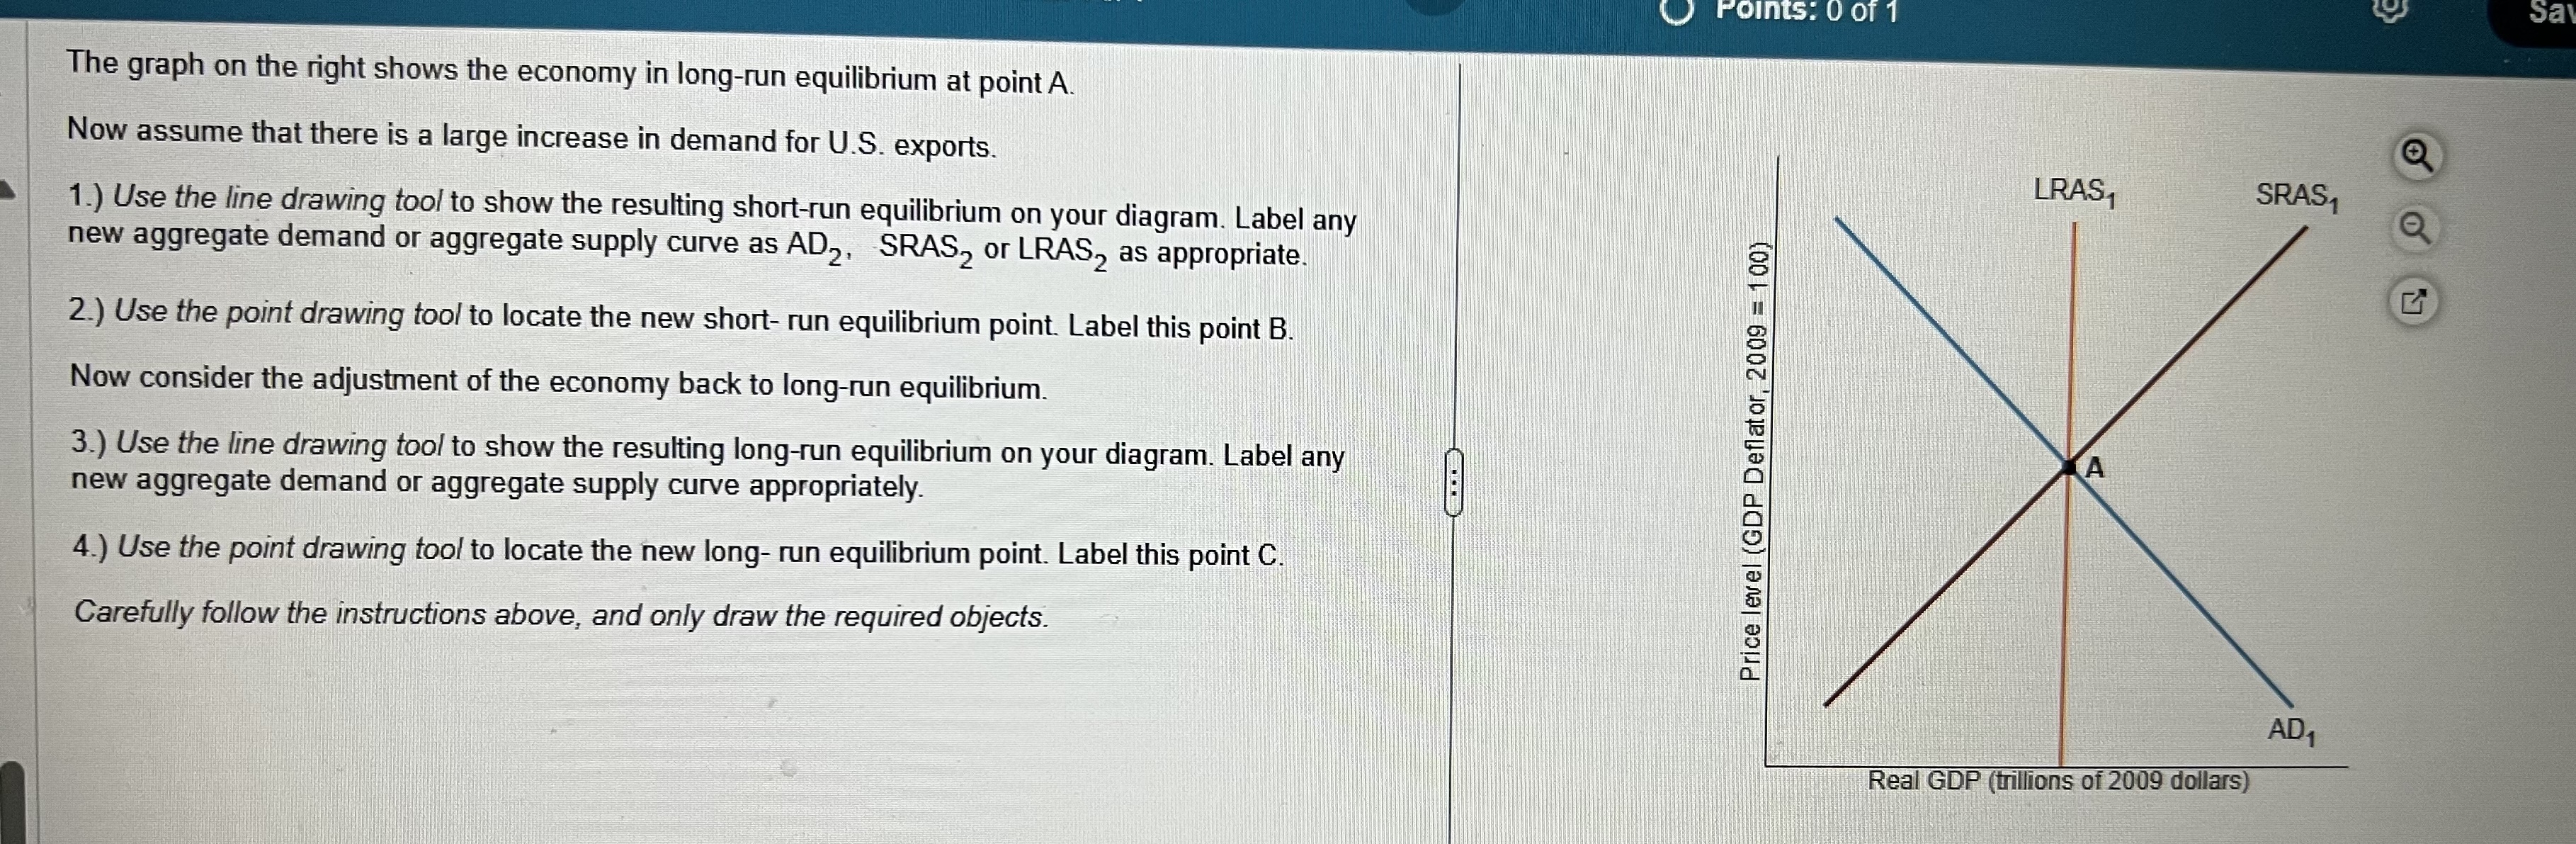
Assume that the growth rate for real GDP between 2016 and 2017 is 0,32 percentage points higher than the percentage change in potential output between those years (rounded to two decimal places). LRAS20 16 SRAS 2016 2016 2017 Real GDP $16.7 trillion $ 17 trillion Potential GDP $16.9 trillion $17.1 trillion GDP Deflator 111.5 113.6 Price level (GDP Deflator, 2009 = 100) (Enter your responses rounded to one decimal place.) 111.5 Draw a dynamic aggregate demand and aggregate supply graph to illustrate your answer. 1.) Use the line drawing tool to draw the new aggregate demand curve and label this as AD2017- 2.) Use the line drawing tool to draw the new short-run aggregate supply curve and label this as SRAS 2017- 16.7: 16.9 AD 2016 3.) Use the point drawing tool to locate the new short- run equilibrium point. Label this point B. Real GDP (trillions of 2009 dollars) 4.) Use the line drawing tool to draw the new long-run aggregate supply curve and label this as LRAS2017- Carefully follow the instructions above, and only draw the required objects.Points: 0 of 1 Sa The graph on the right shows the economy in long-run equilibrium at point A. Now assume that there is a large increase in demand for U.S. exports. LRAS SRAS1 1.) Use the line drawing tool to show the resulting short-run equilibrium on your diagram. Label any new aggregate demand or aggregate supply curve as AD2, SRAS, or LRAS2 as appropriate. 2.) Use the point drawing tool to locate the new short- run equilibrium point. Label this point B. Now consider the adjustment of the economy back to long-run equilibrium. 3.) Use the line drawing tool to show the resulting long-run equilibrium on your diagram. Label any Price level (GDP Deflator, 2009 = 100) A new aggregate demand or aggregate supply curve appropriately. 4.) Use the point drawing tool to locate the new long- run equilibrium point. Label this point C. Carefully follow the instructions above, and only draw the required objects. AD Real GDP (trillions of 2009 dollars)
Step by Step Solution
There are 3 Steps involved in it

Get step-by-step solutions from verified subject matter experts