

Question: Please help me with this. question av 13 pts [This is a le upload question. You can draw your graphs with a computer or hand
Please help me with this.
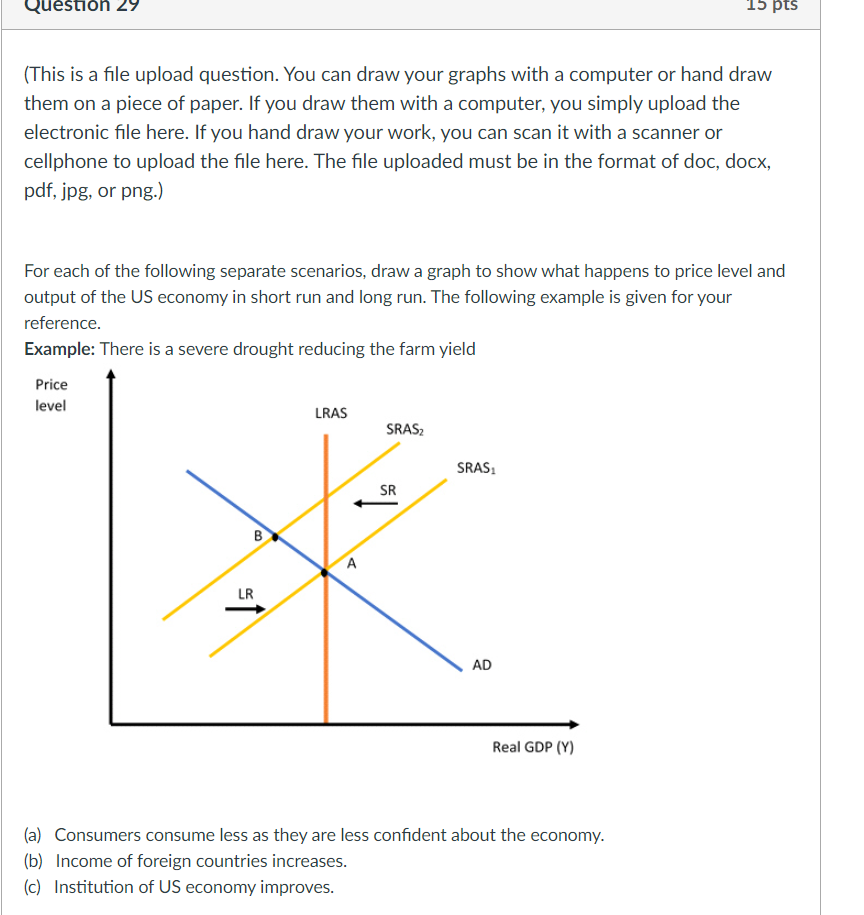
question av 13 pts [This is a le upload question. You can draw your graphs with a computer or hand draw them on a piece of paper. If you draw them with a computer, you simply upload the electronic le here. If you hand draw your work. you can scan it with a scanner or cellphone to upload the le here. The le uploaded must be in the format of doc, docx, pdf. jpg, or rang-l For each of the following separate scenarios, draw a graph to show what happens to price level and output of the US economy in short run and long run. The following example is given foryour reference. Example: There is a severe drought reducing the farm yield Price level Real GDP [Y] la) Consumers consume less as they are less condent about the economy. {bl Income of foreign countries increases. [cl Institution of US economy improves
Step by Step Solution
There are 3 Steps involved in it

Get step-by-step solutions from verified subject matter experts