

Question: Please help me with this question B less 3. Graphing. a. Using the labeled indifference graph below for good A (horizontal axis) and Good B,
Please help me with this question
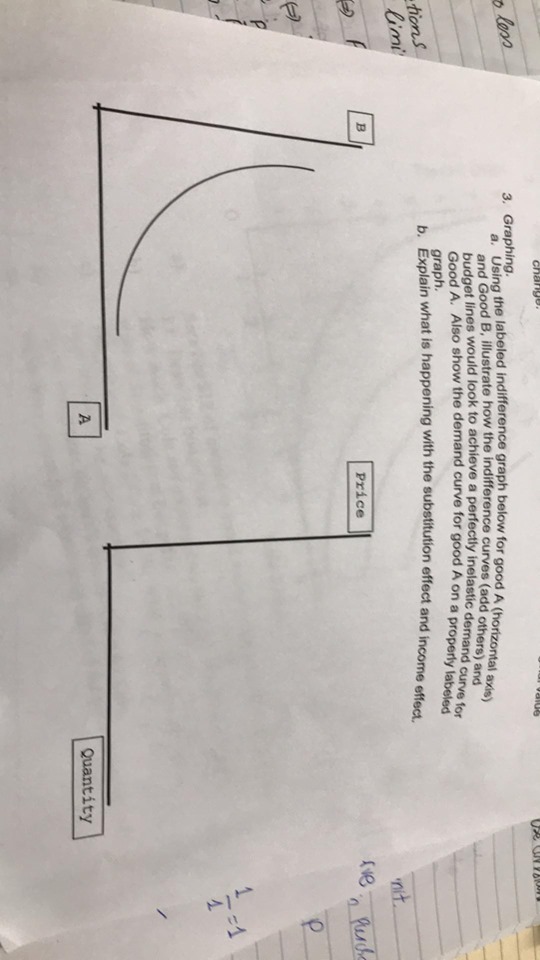
B less 3. Graphing. a. Using the labeled indifference graph below for good A (horizontal axis) and Good B, illustrate how the indifference curves (add others) and budget lines would look to achieve a perfectly inelastic demand curve for tions graph. Good A. Also show the demand curve for good A on a properly labeled limit b. Explain what is happening with the substitution effect and income effect. B nit Price five P =1 A Quantity
Step by Step Solution
There are 3 Steps involved in it
1 Expert Approved Answer
Step: 1 Unlock

Question Has Been Solved by an Expert!
Get step-by-step solutions from verified subject matter experts
Step: 2 Unlock
Step: 3 Unlock