

Question: Please help me with this question. Instructions are in image 1 and question is in image 2 and 3 Instructions: Case Set 4.1 - One
Please help me with this question. Instructions are in image 1 and question is in image 2 and 3
Instructions:
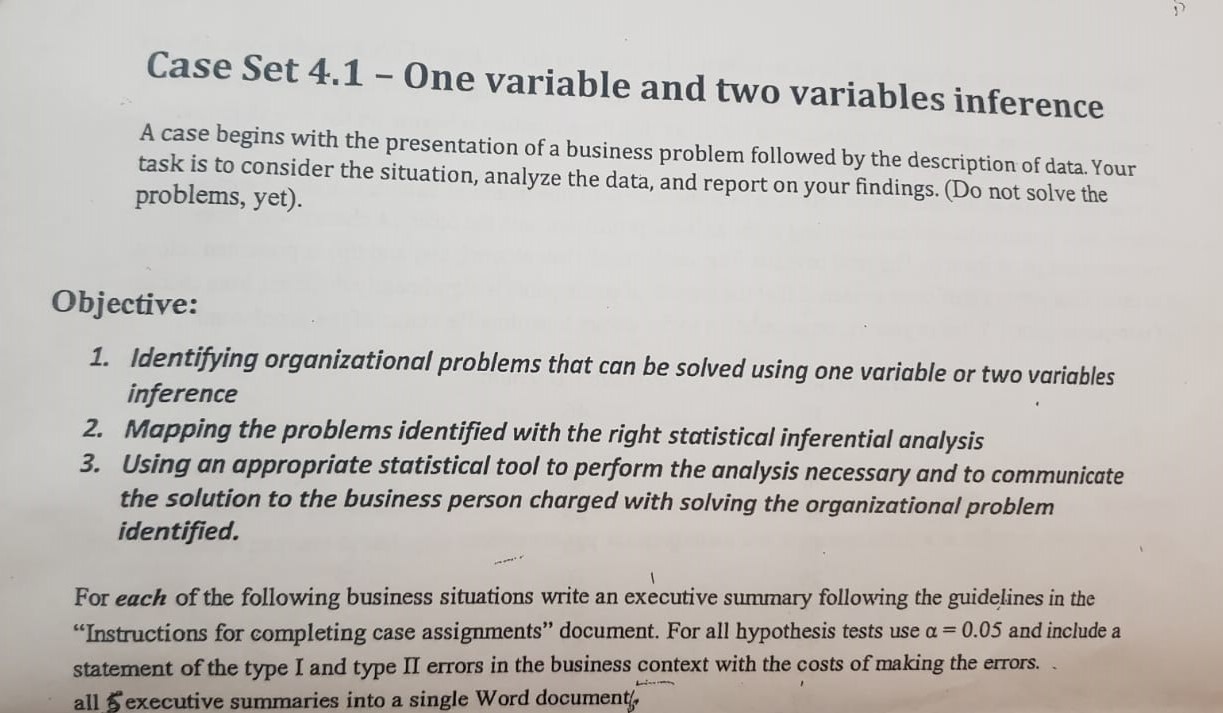
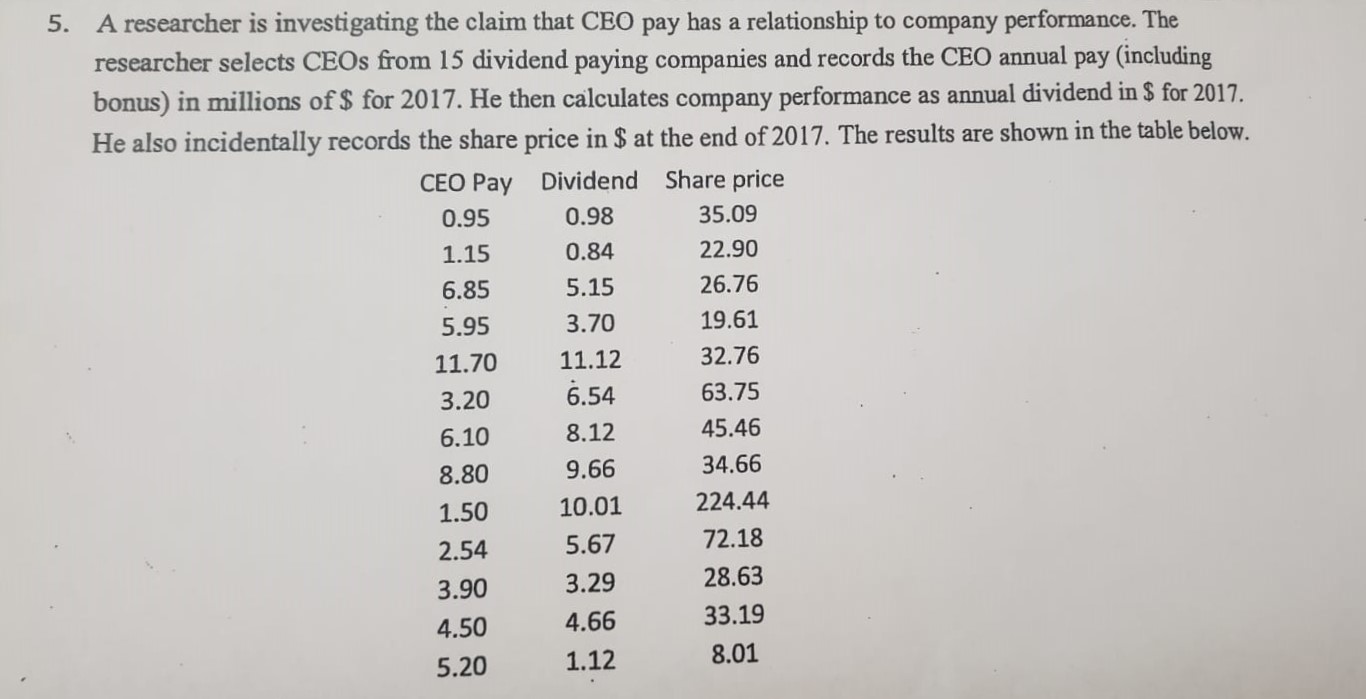
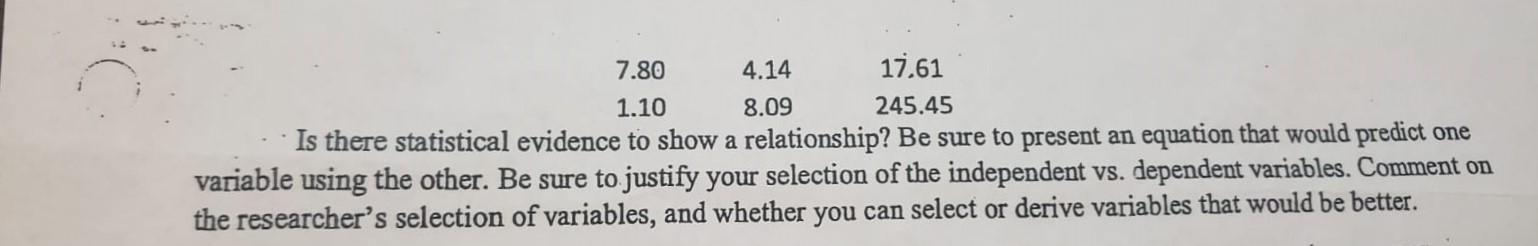
Case Set 4.1 - One variable and two variables inference A case begins with the presentation of a business problem followed by the description of data. Your problems, yet). task is to consider the situation, analyze the data, and report on your findings. (Do not solve the Objective: 1. Identifying organizational problems that can be solved using one variable or two variables inference 2. Mapping the problems identified with the right statistical inferential analysis 3. Using an appropriate statistical tool to perform the analysis necessary and to communicate the solution to the business person charged with solving the organizational problem identified. For each of the following business situations write an executive summary following the guidelines in the "Instructions for completing case assignments" document. For all hypothesis tests use a = 0.05 and include a statement of the type I and type II errors in the business context with the costs of making the errors. . all 5 executive summaries into a single Word document,5. A researcher is investigating the claim that CEO pay has a relationship to company performance. The researcher selects CEOs from 15 dividend paying companies and records the CEO annual pay (including bonus) in millions of $ for 2017. He then calculates company performance as annual dividend in $ for 2017. He also incidentally records the share price in $ at the end of 2017. The results are shown in the table below. CEO Pay Dividend Share price 0.95 0.98 35.09 1.15 0.84 22.90 6.85 5.15 26.76 5.95 3.70 19.61 11.70 11.12 32.76 3.20 6.54 63.75 6.10 8.12 45.46 8.80 9.66 34.66 1.50 10.01 224.44 2.54 5.67 72.18 3.90 3.29 28.63 4.50 4.66 33.19 5.20 .12 8.017.80 4.14 17.61 1.10 8.09 245.45 . Is there statistical evidence to show a relationship? Be sure to present an equation that would predict one variable using the other. Be sure to justify your selection of the independent vs. dependent variables. Comment on the researcher's selection of variables, and whether you can select or derive variables that would be better
Step by Step Solution
There are 3 Steps involved in it

Get step-by-step solutions from verified subject matter experts