

Question: Please help me with this question. Please explain in detail. Thanks. 7) Let's use the the data above for female kestrel length. Here are the
Please help me with this question. Please explain in detail. Thanks.
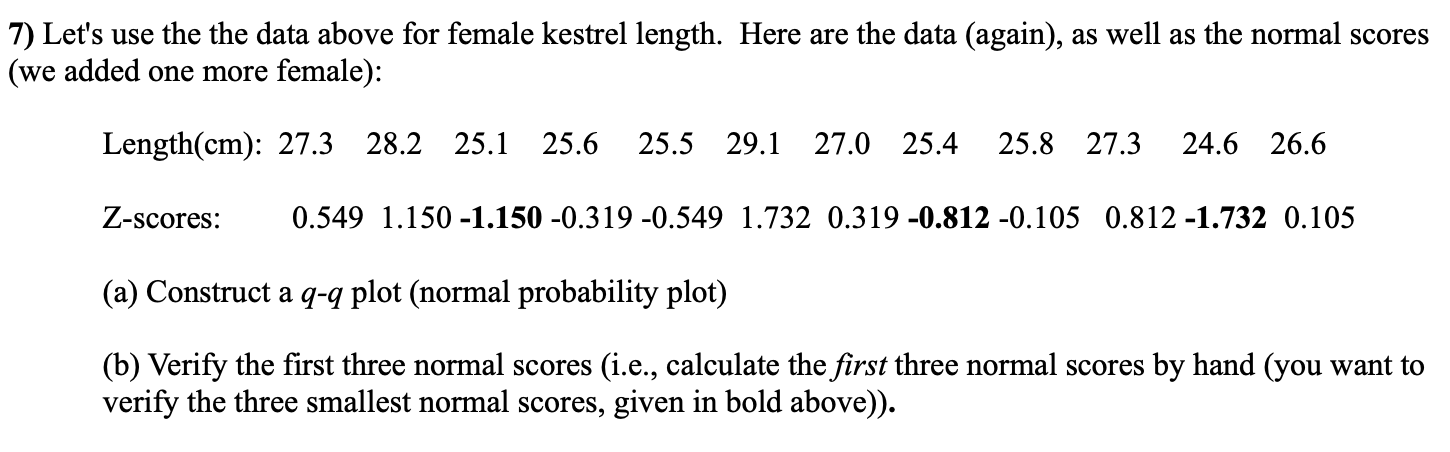
7) Let's use the the data above for female kestrel length. Here are the data (again), as well as the normal scores (we added one more female): Length(cm): 27.3 28.2 25.1 25.6 25.5 29.1 27.0 25.4 25.8 27.3 24.6 26.6 Zscores: 0.549 1.150 -1.150 -0.319 -0.549 1.732 0.319 41.812 -0.105 0.812 -1.732 0.105 (a) Construct a q-q plot (normal probability plot) (b) Verify the rst three normal scores (i.e., calculate the rst three normal scores by hand (you want to verify the three smallest normal scores, given in bold above. \f
Step by Step Solution
There are 3 Steps involved in it
1 Expert Approved Answer
Step: 1 Unlock

Question Has Been Solved by an Expert!
Get step-by-step solutions from verified subject matter experts
Step: 2 Unlock
Step: 3 Unlock