

Question: Please help me with this question: Question 7 2 pts Since 2006, the percentage of smokers in the United States appears to be decreasing linearly.
Please help me with this question:
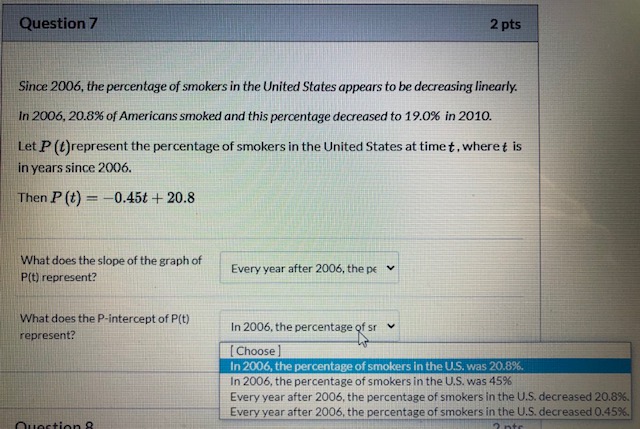
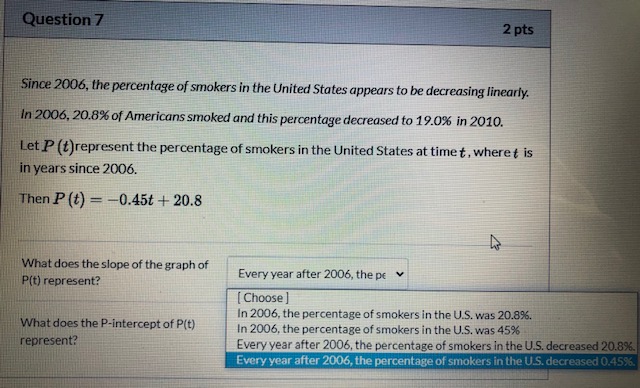
Question 7 2 pts Since 2006, the percentage of smokers in the United States appears to be decreasing linearly. In 2006, 20.8% of Americans smoked and this percentage decreased to 19.0% in 2010. Let P (t)represent the percentage of smokers in the United States at time t , where t is in years since 2006. Then P (t) = -0.45t + 20.8 What does the slope of the graph of P(t) represent? Every year after 2006, the pe v What does the P-intercept of P(t) represent? In 2006, the percentage of sr v [ Choose ] In 2006, the percentage of smokers in the U.S. was 20.8%. In 2006, the percentage of smokers in the U.S. was 45% Every year after 2006, the percentage of smokers in the U.5. decreased 20.86. Every year after 2006, the percentage of smokers in the U.S. decreased 0.456.Question 7 2 pts Since 2006, the percentage of smokers in the United States appears to be decreasing linearly. In 2006, 20.8% of Americans smoked and this percentage decreased to 19.0% in 2010. Let P (t)represent the percentage of smokers in the United States at time t, where f is in years since 2006. Then P (t) - -0.45t + 20.8 What does the slope of the graph of P(t) represent? Every year after 2006, the pe v [ Choose ] What does the P-intercept of P(t) In 2006, the percentage of smokers in the U.S. was 20.8%. In 2006, the percentage of smokers in the U.S. was 45% represent? Every year after 2006, the percentage of smokers in the U.S. decreased 20.896. Every year after 2006, the percentage of smokers in the U.S. decreased 0.4596
Step by Step Solution
There are 3 Steps involved in it

Get step-by-step solutions from verified subject matter experts