

Question: please help me with this question The graph below illustrates hypothetical supply and demand curves for the Canadian dollar. Use the graph to answer the
please help me with this question
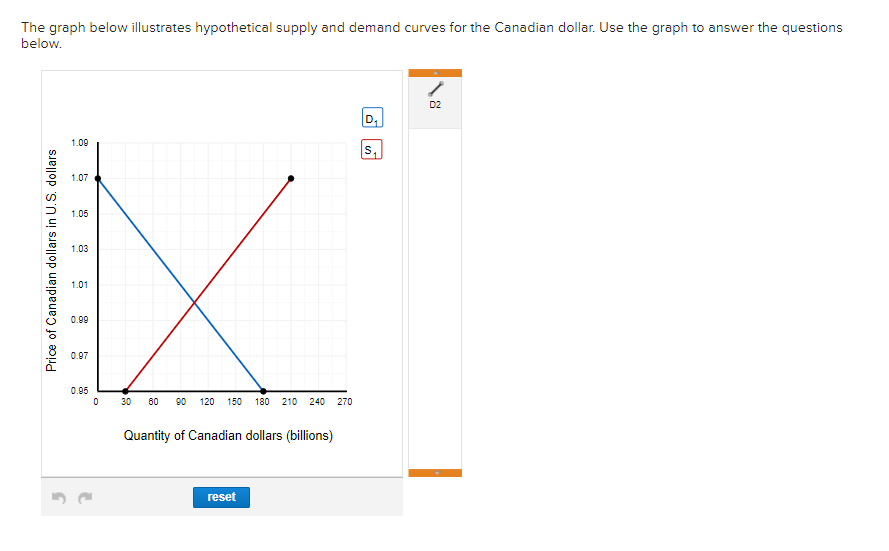
The graph below illustrates hypothetical supply and demand curves for the Canadian dollar. Use the graph to answer the questions below. D2 1.09 S , 1.07 1.05 1.03 Price of Canadian dollars in U.S. dollars 1.01 0.99 0.97 0.95 30 60 80 120 150 180 210 240 270 Quantity of Canadian dollars (billions) reseta. What is the quantity of dollars exchanged, given D, and S1? 105 billion. b. What is this quantity worth in U.S. dollars? Round your answer to 1 decimal place. 105 billion in the U.S. c.If the demand for the dollar increases by 60, draw in the new demand curve labelled D2. On the graph above, plot only the endpoints of the curve. d. What is the quantity of Canadian dollars exchanged if the exchange rate is flexible? quantity of Canadian $ exchanged: $ billion. Suppose instead that the dollar is fixed at the original value. e. As a result of the change in (c), what is the quantity of Canadian dollars exchanged? billion. f. What is this quantity worth in U.S. dollars? Round your answer to 1 decimal place. billion in the U.S
Step by Step Solution
There are 3 Steps involved in it

Get step-by-step solutions from verified subject matter experts