

Question: please help me with this questions... this is one full wuestion do it with workings showing.. if everything is coreect i will leave a great
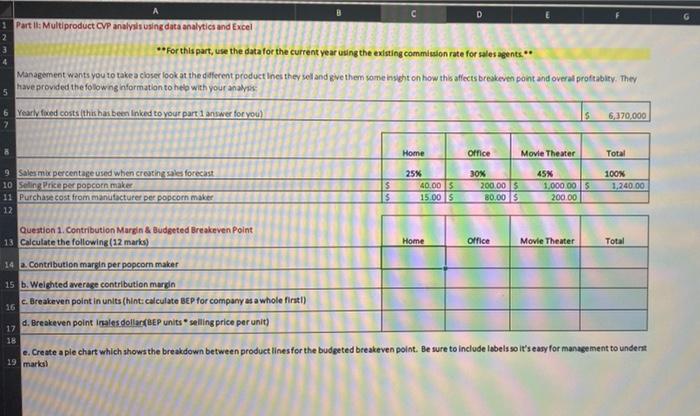
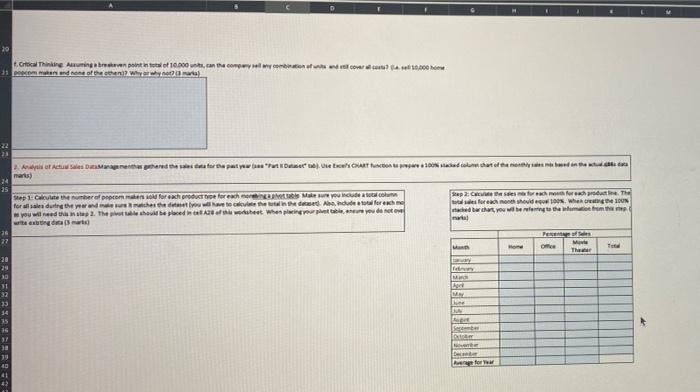


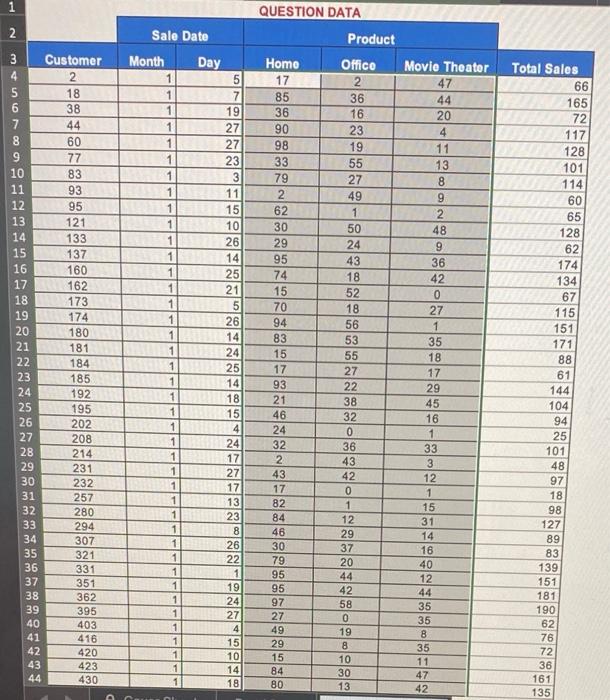
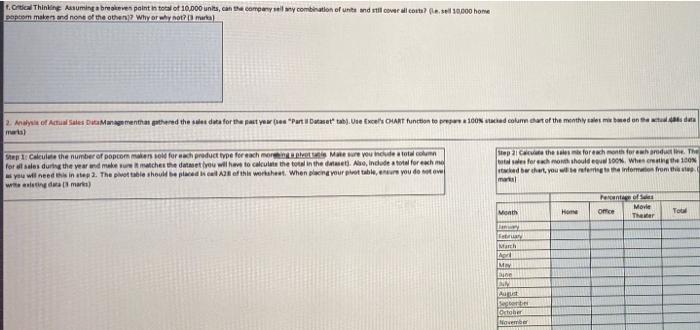
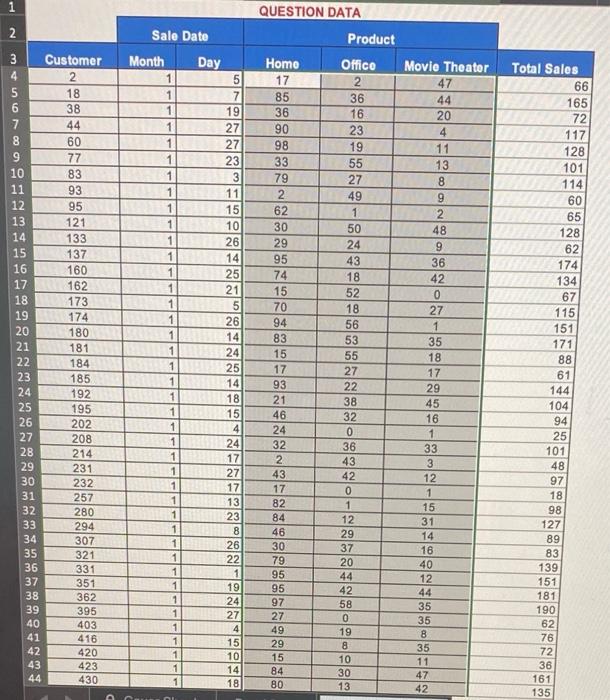
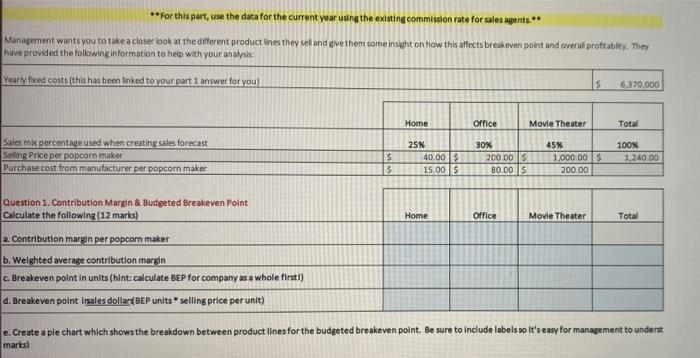
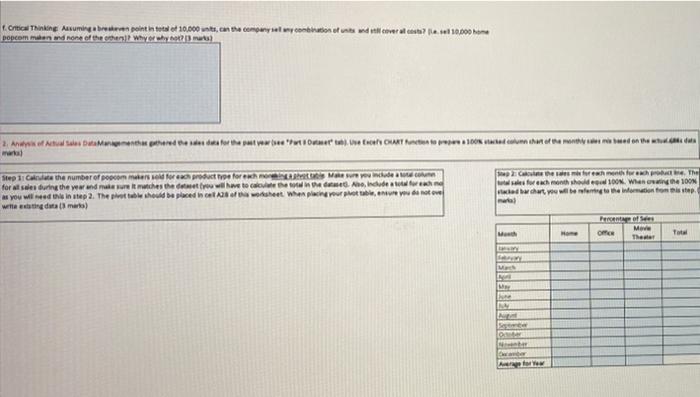
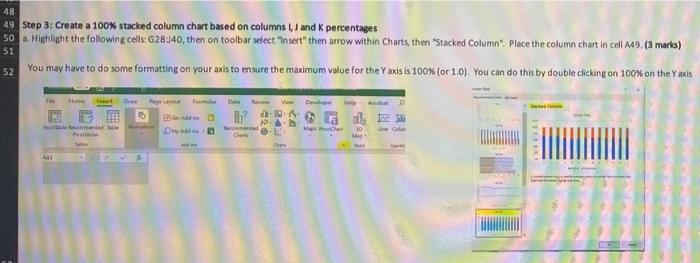
D Partil: Multiproduct CVP analysis using data analytics and Excel **For this part, use the data for the current year using the existing commission rate for sales agents ** Management wants you to take a closer look at the different product Ines they sell and pve them some insight on how this affects breakeven point and overal profitable. They have provided the folowng information to help with your analys 6 Yearly fixed costs this has been linked to your parti answer for you) 6.370,000 Home Office Movie Theater Total 9 Sales me percentage used when creating sales forecast 10 Selling Price per popcorn maker 11 Purchase cost from manufacturer per popcorn maker 12 25% 40.005 15.00 $ $ 30% 200.00 15 80.00 $ 100% 1.240.00 45% 1,000.00 5 200.00 Home Office Movie Theater Total Question 1. Contribution Margin & Budgeted Breakeven Point 13 Calculate the following (12 marks) 14 2.Contribution margin per popcorn maker 15 b. Weighted average contribution margin c. Breakeven point in units (hints calculate BEP for company as a whole first!) 16 d. Breakeven point inales dollar(EP units * selling price per unit) 17 18 e.Create a ple chart which shows the breakdown between product lines for the budgeted breakeven point. Be sure to include labels so it's easy for management to unders 19 marks t.Crtical Thinking point 10.000 unti, con scomwelwyn w rower? 4 af 600 11 Dand one of the then why -22 23 Art Author at DAR 100 add to that of the G 24 25 Sep 1. Catherefponendfor each producte for each or Male de com ep 2: Cofre forth. The for all during the wonder how the deed de forma foreach, when the 100N you will need 2. The head in 128 het when you do not tied a chart, you lethem from ng ma 26 27 The 28 29 30 11 32 33 34 35 31 38 formar 4 D 43 44 45 46 47 48 49 Step 3: Create a 100% stacked column chart based on columns WJ and K percentages 50 a Highlight the following cells 628340, then on toolbar select "insert then arrow within Charts, then "Stacked Column Place the column chart in cell 49. (3 marks) 51 You may have to do some formatting on your axis to ensure the maximum value for the Y axis is 100% for 1.0). You can do this by double clicking on 100% on the Yaxis 52 Dm - N- Oh 43 53 55 Interpret the stacked chart above. What do these results mean? How does it compare to the budenied de la marka Using the actual complete the following (11 marts): 58 Home Office Movie Theater Total 50 60 Actual sales this has been linked for you Question Sup 2. now 431 61 Contribution mare per unit linked to tou 14 for you ON X ON ON 62 a. Welchted average contribution marrin perunt based on actual sales mix 63 b. Breakeven point in units for each product line based on actual sales mix c.Create a ple chart which show the breakdown between product lines for the breakeven pont based on the actual sea elemark). Be sure to include labels en for management to undentand (marts) 05 66 Question 4: Critical Thinking Analysis (10 marts a. Matt and Mya were expecting to be more profitable this past year and are looking to you for an explanation. Be sure to reference the analys youve completed and 68 min insanaman ran undrand 10 market 699 A 66 67 Question 4: Critical Thinking/Analysis (10 marks) 2. Matt and Mya were expecting to be more profitable this past year and are looking to you for an explanation. Be sure to reference to analysis you've completed and 68 aynlain in a non- wountant ran understand 110 marvel 69 70 71 72 b. Do you have any recommendations for the company going forward based on your analysis? (5 marts) 73 74 75 76 77 1 QUESTION DATA Product 2 Sale Date Day 5 7 19 27 Home 17 85 36 90 98 33 79 2 62 30 29 95 74 15 23 3 11 15 10 Movie Theater 47 44 20 4 11 13 8 9 2 48 9 Total Sales 66 165 72 117 128 101 114 60 65 26 36 70 22 3 Customer 4 2 5 18 6 38 7 44 8 60 9 77 10 83 11 93 12 95 13 121 14 133 15 137 16 160 17 162 18 173 19 174 20 180 21 181 184 23 185 24 192 25 195 202 27 208 28 214 29 231 30 232 31 257 32 280 33 294 34 307 35 321 36 331 37 351 38 362 39 395 40 403 41 416 42 420 43 44 430 Month 1 1 1 1 1 1 1 1 1 1 1 1 1 1 1 1 1 1 1 1 1 1 1 1 1 1 1 1 1 1 1 1 1 1 1 1 1 1 1 1 1 14 25 21 5 26 14 24 25 14 18 15 4 24 17 27 17 13 23 8 26 22 1 19 24 27 4 15 10 14 18 Office 2 36 16 23 19 55 27 49 1 50 24 43 18 52 18 56 53 55 27 22 38 32 0 36 43 42 0 1 12 29 37 20 44 42 58 0 19 8 10 30 13 94 83 15 17 93 21 46 24 32 2 43 17 82 84 46 30 79 95 95 97 27 49 29 15 84 80 26 42 0 27 1 35 18 17 29 45 16 1 33 3 12 1 15 31 128 62 174 134 67 115 151 171 88 61 144 104 94 25 101 48 97 18 98 127 89 83 139 151 181 190 62 76 72 36 161 135 14 2 16 40 12 44 35 35 8 35 11 47 42 1 423 1 f. Crtle Thinking Assuming a breakeve paint in total of 10,000 unts, can the company wil my combination of unte und still cover it coutu? (30.000 home pepeo maker and none of the other? Why or why not?. marta 2. Analysis of Anu Sales Management thered the data for the yewe Partasetta).Use Els CHART function to a 100N id column of the menthe bed on the det mais) Sep 1: Calculate the number of popcom mers sold for each product type for each Me sure you a total com for villes during the year and make sure matches the dataset you will have to calculate the town in the det). Also include a total forethe you will need in step 2. The portable should be placed all of this worksheet. When placing your potable, ere you do now wa mar Step them for each month for whared in The foreach month should Wheersing the 100N berhart, you to the information from the mata Pente Orice More Theer Month Home Total Murh Apr M Dinn M AUS actor October November 1 QUESTION DATA Product 2 Sale Date Day 5 7 38 ONN Movie Theater 47 44 20 4. 11 13 8 9 2 48 9 36 42 0 27 3 Customer 4 2 5 18 6 7 44 8 60 9 77 10 83 11 93 12 95 13 121 14 133 15 137 16 160 17 162 18 173 19 174 20 180 21 181 22 184 23 185 24 192 25 195 26 202 27 208 28 214 29 231 30 232 31 257 32 280 33 294 34 307 35 321 36 331 37 351 38 362 39 395 40 403 41 416 42 420 43 44 430 Month 1 1 1 1 1 1 1 1 1 1 1 1 1 1 1 1 1 1 1 1 1 1 1 1 1 1 1 1 1 1 1 1 1 1 1 1 1 1 1 1 1 Homo 17 85 36 90 98 33 79 2 62 30 29 95 74 15 70 94 83 15 17 93 21 46 24 32 2 43 17 82 84 46 30 79 95 95 97 27 49 29 15 84 80 23 3 11 15 10 26 14 25 21 5 26 14 24 25 14 18 15 4 24 17 27 17 131 23 8 26 22 1 19 24 27 4 15 10 14 18 Office 2 36 16 23 19 55 27 49 1 50 24 43 18 52 18 56 53 55 27 22 38 32 0 36 43 42 0 1 12 29 37 20 44 42 58 0 19 8 10 30 13 1 35 18 17 29 45 Total Sales 66 165 72 117 128 101 114 60 65 128 62 174 134 67 115 151 171 88 61 144 104 94 25 101 48 97 18 98 127 89 83 139 151 181 190 62 76 72 36 161 135 16 1 33 3 12 1 15 31 14 16 40 12 44 35 35 8 35 11 47 42 423 1 **For this part, use the data for the current year using the existing commission rate for sales agents. Management wants you to take a closer look at the different product lines they set and give them some insight on how this affects breakiven point and overall profitably. They have provided the following information to help with your analysis Yearly fixed costs(this has been linked to your part 1 answer for you 6,370.000 Home Office Movie Theater Total Sales ma percentage used when creating sales forecast Selling Price per popcorn maker Purchase cost from manufacturer per popcorn makes 25% 40.00 15.00 $ $ 30% 200.00 B0.00 $ 45% 1.000.00 200.00 100% 1,240.00 Question 1. Contribution Margin & Budgeted Breakeven Point Calculate the following (12 marks) Home Office Movie Theater Total a. Contribution margin per popcorn maker b. Weighted average contribution mandin c. Breakeven point in units (hint: calculate BEP for company as a whole first!) d. Breakeven point Irsales dollar/BEP units selling price per unit) e. Create a ple chart which shows the breakdown between product lines for the budgeted breakeven point. Be sure to include labels so it's easy for management to underst martesi Critical Thinking Asuminen point 30.000 ints, can the comwww ws combination of units wide over de 10.000 hom Docommand one of them? Why or why?? 2. Anwetterede den for the weet One. To that of the bed on the wat Step 11 Cate the number of popcorner for product Type each in Mindade for at se during the war und malereiches the deterou will have to take on Abo, include a fred as you will Intep 2. The ta should be placed in All of the when planer co wietnams) e The for each month 100Wien 100N Tatatha mari amman temptep Profe Om Me Total ME 48 49 Step 3: Create a 100% stacked column chart based on columns WJ and K percentages 50 a Highlight the following cells: G28:40, then on toolbar select "Insert" then arrow within Charts, then "Stacked Column". Place the column chart in cell A49. (3 marks) You may have to do some formatting on your axis to ensure the maximum value for the Yaxis is 100% (or 1.0). You can do this by double clicking on 100% on the Yanis 51 52 ve ha DA 10 Che ne mungen som in total of 16,000 to, con the company leonention of we were con i costa? . 110.00 mm 01 popron men and more of the the Worlar 23 2. As of Actual Mintha gathered the data for the ww Port Date Use Titre 100% del to the othed on the mara) 24 26 Step 1: Calculateur ber of popcorn es sold for each product type for each moningoplas Make sure you include a total column Step 2: Chce the foreach month forex routine The for all sales during the year and make sure matches the date will have to calculate the town the det. Ahe, ndote for eachine total was for each one should soon. When creating the 100N s you will need this ap 2. The plate should be placed in all of this worksheet When pleine verre you do not Hacked what you theregte enfomation from the write existing data mats) mata 20 27 Pad Movie Man Home Office Tata Thr 21 29 February 30 M 51 12 MAY 3 34 35 36 She 37 Odo 38 November 39 December A for Wear D Partil: Multiproduct CVP analysis using data analytics and Excel **For this part, use the data for the current year using the existing commission rate for sales agents ** Management wants you to take a closer look at the different product Ines they sell and pve them some insight on how this affects breakeven point and overal profitable. They have provided the folowng information to help with your analys 6 Yearly fixed costs this has been linked to your parti answer for you) 6.370,000 Home Office Movie Theater Total 9 Sales me percentage used when creating sales forecast 10 Selling Price per popcorn maker 11 Purchase cost from manufacturer per popcorn maker 12 25% 40.005 15.00 $ $ 30% 200.00 15 80.00 $ 100% 1.240.00 45% 1,000.00 5 200.00 Home Office Movie Theater Total Question 1. Contribution Margin & Budgeted Breakeven Point 13 Calculate the following (12 marks) 14 2.Contribution margin per popcorn maker 15 b. Weighted average contribution margin c. Breakeven point in units (hints calculate BEP for company as a whole first!) 16 d. Breakeven point inales dollar(EP units * selling price per unit) 17 18 e.Create a ple chart which shows the breakdown between product lines for the budgeted breakeven point. Be sure to include labels so it's easy for management to unders 19 marks t.Crtical Thinking point 10.000 unti, con scomwelwyn w rower? 4 af 600 11 Dand one of the then why -22 23 Art Author at DAR 100 add to that of the G 24 25 Sep 1. Catherefponendfor each producte for each or Male de com ep 2: Cofre forth. The for all during the wonder how the deed de forma foreach, when the 100N you will need 2. The head in 128 het when you do not tied a chart, you lethem from ng ma 26 27 The 28 29 30 11 32 33 34 35 31 38 formar 4 D 43 44 45 46 47 48 49 Step 3: Create a 100% stacked column chart based on columns WJ and K percentages 50 a Highlight the following cells 628340, then on toolbar select "insert then arrow within Charts, then "Stacked Column Place the column chart in cell 49. (3 marks) 51 You may have to do some formatting on your axis to ensure the maximum value for the Y axis is 100% for 1.0). You can do this by double clicking on 100% on the Yaxis 52 Dm - N- Oh 43 53 55 Interpret the stacked chart above. What do these results mean? How does it compare to the budenied de la marka Using the actual complete the following (11 marts): 58 Home Office Movie Theater Total 50 60 Actual sales this has been linked for you Question Sup 2. now 431 61 Contribution mare per unit linked to tou 14 for you ON X ON ON 62 a. Welchted average contribution marrin perunt based on actual sales mix 63 b. Breakeven point in units for each product line based on actual sales mix c.Create a ple chart which show the breakdown between product lines for the breakeven pont based on the actual sea elemark). Be sure to include labels en for management to undentand (marts) 05 66 Question 4: Critical Thinking Analysis (10 marts a. Matt and Mya were expecting to be more profitable this past year and are looking to you for an explanation. Be sure to reference the analys youve completed and 68 min insanaman ran undrand 10 market 699 A 66 67 Question 4: Critical Thinking/Analysis (10 marks) 2. Matt and Mya were expecting to be more profitable this past year and are looking to you for an explanation. Be sure to reference to analysis you've completed and 68 aynlain in a non- wountant ran understand 110 marvel 69 70 71 72 b. Do you have any recommendations for the company going forward based on your analysis? (5 marts) 73 74 75 76 77 1 QUESTION DATA Product 2 Sale Date Day 5 7 19 27 Home 17 85 36 90 98 33 79 2 62 30 29 95 74 15 23 3 11 15 10 Movie Theater 47 44 20 4 11 13 8 9 2 48 9 Total Sales 66 165 72 117 128 101 114 60 65 26 36 70 22 3 Customer 4 2 5 18 6 38 7 44 8 60 9 77 10 83 11 93 12 95 13 121 14 133 15 137 16 160 17 162 18 173 19 174 20 180 21 181 184 23 185 24 192 25 195 202 27 208 28 214 29 231 30 232 31 257 32 280 33 294 34 307 35 321 36 331 37 351 38 362 39 395 40 403 41 416 42 420 43 44 430 Month 1 1 1 1 1 1 1 1 1 1 1 1 1 1 1 1 1 1 1 1 1 1 1 1 1 1 1 1 1 1 1 1 1 1 1 1 1 1 1 1 1 14 25 21 5 26 14 24 25 14 18 15 4 24 17 27 17 13 23 8 26 22 1 19 24 27 4 15 10 14 18 Office 2 36 16 23 19 55 27 49 1 50 24 43 18 52 18 56 53 55 27 22 38 32 0 36 43 42 0 1 12 29 37 20 44 42 58 0 19 8 10 30 13 94 83 15 17 93 21 46 24 32 2 43 17 82 84 46 30 79 95 95 97 27 49 29 15 84 80 26 42 0 27 1 35 18 17 29 45 16 1 33 3 12 1 15 31 128 62 174 134 67 115 151 171 88 61 144 104 94 25 101 48 97 18 98 127 89 83 139 151 181 190 62 76 72 36 161 135 14 2 16 40 12 44 35 35 8 35 11 47 42 1 423 1 f. Crtle Thinking Assuming a breakeve paint in total of 10,000 unts, can the company wil my combination of unte und still cover it coutu? (30.000 home pepeo maker and none of the other? Why or why not?. marta 2. Analysis of Anu Sales Management thered the data for the yewe Partasetta).Use Els CHART function to a 100N id column of the menthe bed on the det mais) Sep 1: Calculate the number of popcom mers sold for each product type for each Me sure you a total com for villes during the year and make sure matches the dataset you will have to calculate the town in the det). Also include a total forethe you will need in step 2. The portable should be placed all of this worksheet. When placing your potable, ere you do now wa mar Step them for each month for whared in The foreach month should Wheersing the 100N berhart, you to the information from the mata Pente Orice More Theer Month Home Total Murh Apr M Dinn M AUS actor October November 1 QUESTION DATA Product 2 Sale Date Day 5 7 38 ONN Movie Theater 47 44 20 4. 11 13 8 9 2 48 9 36 42 0 27 3 Customer 4 2 5 18 6 7 44 8 60 9 77 10 83 11 93 12 95 13 121 14 133 15 137 16 160 17 162 18 173 19 174 20 180 21 181 22 184 23 185 24 192 25 195 26 202 27 208 28 214 29 231 30 232 31 257 32 280 33 294 34 307 35 321 36 331 37 351 38 362 39 395 40 403 41 416 42 420 43 44 430 Month 1 1 1 1 1 1 1 1 1 1 1 1 1 1 1 1 1 1 1 1 1 1 1 1 1 1 1 1 1 1 1 1 1 1 1 1 1 1 1 1 1 Homo 17 85 36 90 98 33 79 2 62 30 29 95 74 15 70 94 83 15 17 93 21 46 24 32 2 43 17 82 84 46 30 79 95 95 97 27 49 29 15 84 80 23 3 11 15 10 26 14 25 21 5 26 14 24 25 14 18 15 4 24 17 27 17 131 23 8 26 22 1 19 24 27 4 15 10 14 18 Office 2 36 16 23 19 55 27 49 1 50 24 43 18 52 18 56 53 55 27 22 38 32 0 36 43 42 0 1 12 29 37 20 44 42 58 0 19 8 10 30 13 1 35 18 17 29 45 Total Sales 66 165 72 117 128 101 114 60 65 128 62 174 134 67 115 151 171 88 61 144 104 94 25 101 48 97 18 98 127 89 83 139 151 181 190 62 76 72 36 161 135 16 1 33 3 12 1 15 31 14 16 40 12 44 35 35 8 35 11 47 42 423 1 **For this part, use the data for the current year using the existing commission rate for sales agents. Management wants you to take a closer look at the different product lines they set and give them some insight on how this affects breakiven point and overall profitably. They have provided the following information to help with your analysis Yearly fixed costs(this has been linked to your part 1 answer for you 6,370.000 Home Office Movie Theater Total Sales ma percentage used when creating sales forecast Selling Price per popcorn maker Purchase cost from manufacturer per popcorn makes 25% 40.00 15.00 $ $ 30% 200.00 B0.00 $ 45% 1.000.00 200.00 100% 1,240.00 Question 1. Contribution Margin & Budgeted Breakeven Point Calculate the following (12 marks) Home Office Movie Theater Total a. Contribution margin per popcorn maker b. Weighted average contribution mandin c. Breakeven point in units (hint: calculate BEP for company as a whole first!) d. Breakeven point Irsales dollar/BEP units selling price per unit) e. Create a ple chart which shows the breakdown between product lines for the budgeted breakeven point. Be sure to include labels so it's easy for management to underst martesi Critical Thinking Asuminen point 30.000 ints, can the comwww ws combination of units wide over de 10.000 hom Docommand one of them? Why or why?? 2. Anwetterede den for the weet One. To that of the bed on the wat Step 11 Cate the number of popcorner for product Type each in Mindade for at se during the war und malereiches the deterou will have to take on Abo, include a fred as you will Intep 2. The ta should be placed in All of the when planer co wietnams) e The for each month 100Wien 100N Tatatha mari amman temptep Profe Om Me Total ME 48 49 Step 3: Create a 100% stacked column chart based on columns WJ and K percentages 50 a Highlight the following cells: G28:40, then on toolbar select "Insert" then arrow within Charts, then "Stacked Column". Place the column chart in cell A49. (3 marks) You may have to do some formatting on your axis to ensure the maximum value for the Yaxis is 100% (or 1.0). You can do this by double clicking on 100% on the Yanis 51 52 ve ha DA 10 Che ne mungen som in total of 16,000 to, con the company leonention of we were con i costa? . 110.00 mm 01 popron men and more of the the Worlar 23 2. As of Actual Mintha gathered the data for the ww Port Date Use Titre 100% del to the othed on the mara) 24 26 Step 1: Calculateur ber of popcorn es sold for each product type for each moningoplas Make sure you include a total column Step 2: Chce the foreach month forex routine The for all sales during the year and make sure matches the date will have to calculate the town the det. Ahe, ndote for eachine total was for each one should soon. When creating the 100N s you will need this ap 2. The plate should be placed in all of this worksheet When pleine verre you do not Hacked what you theregte enfomation from the write existing data mats) mata 20 27 Pad Movie Man Home Office Tata Thr 21 29 February 30 M 51 12 MAY 3 34 35 36 She 37 Odo 38 November 39 December A for Wear
Step by Step Solution
There are 3 Steps involved in it

Get step-by-step solutions from verified subject matter experts