

Question: Please help me with this solution This is intended to get you to think about different graphical tools to describe data that is collected. It
Please help me with this solution
This is intended to get you to think about different graphical tools to describe data that is collected. It is your job to interpret what you see in the data and what it might mean. Use the data, along with chapter 19 and/or the workbook to describe what may be happening in the process and where the quality engineer should focus their efforts to make improvements. When you use a tool, tell me what you see and what the tool is telling you or the business about the process.
You should use software programs like Excel, Minitab, Statgraphics, QI Macros, SPSS, etc. You may also work this using manual methods if you wish. Feel free to look for templates on the internet, just make sure you can trust any calculations that are made. (Hint: You should be able to do most things in Excel.) Make sure you are descriptive enough for the reader to understand what you are interpreting. Check your spelling and grammar. There is no special format required, but it should be clear and understandable. (I expect to see graphs and visuals of the data.)
The Scenario/Problem:
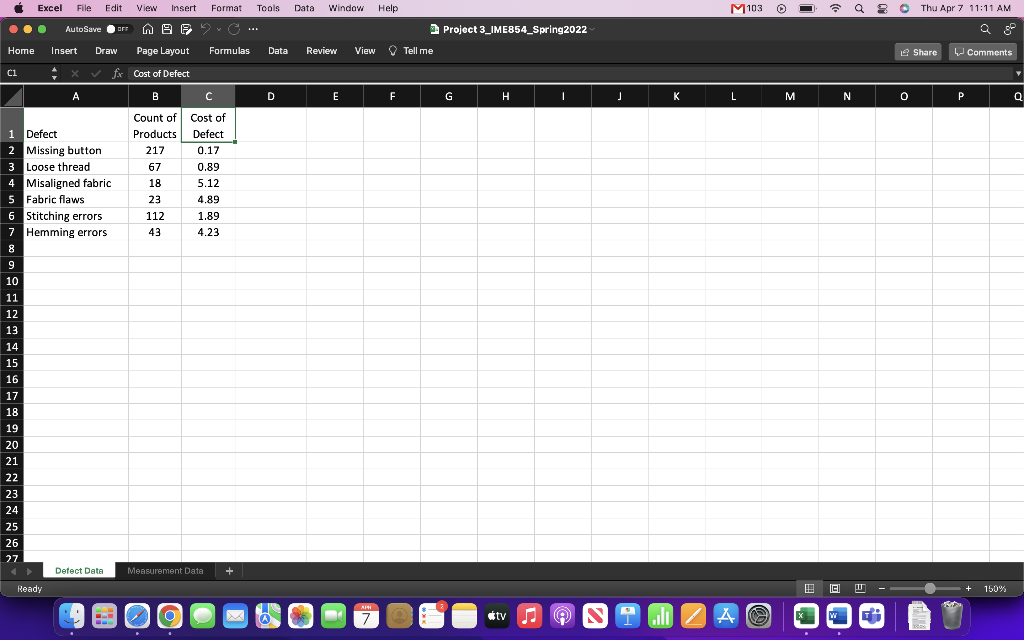
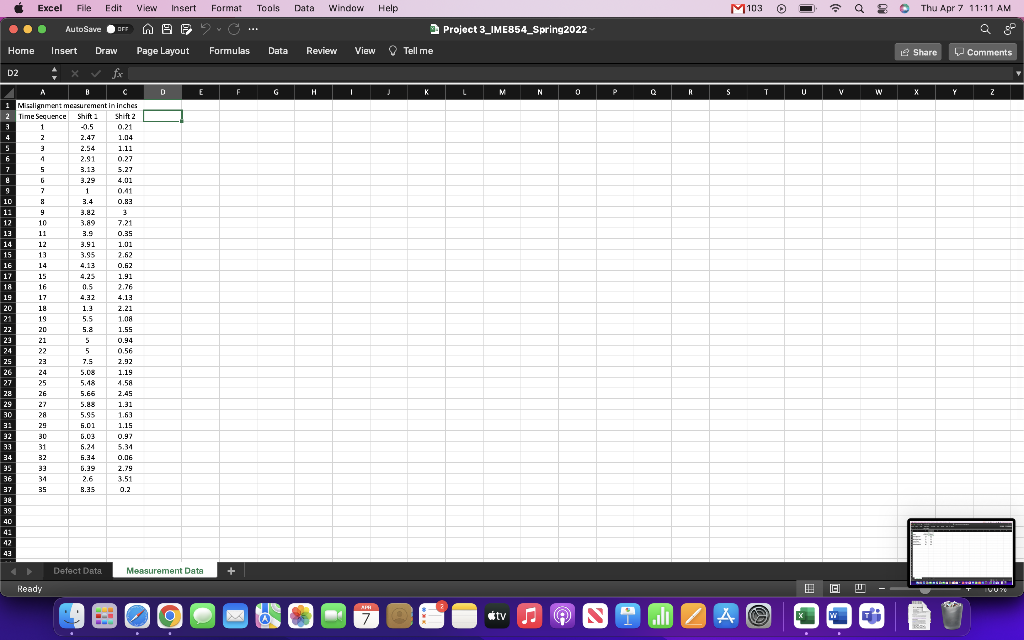
An inspector for a clothing manufacturer investigates sources of clothing defects to prioritize improvement projects. The inspector tracks the number and type of defects in the process. In the Excel file that is available for this project, you are given information/data that was collected by the inspector. You are also given two sets of process data where the inspector measured one of the defects on 1st shift and then again on 2nd shift.
For example, row 5 of the defect data tab indicates that the inspector found 112 stitching errors.
Excel File Edit View Insert Format Tools Data Window Help M103 6 Q R S a Thu Apr 7 11:11 AM ... AutoSave OFF 09 UL Project 3_IME854_Spring 2022 Home Insert Draw Page Layout Formulas Data Review View Tell me E Share Comments ci fx Cost of Defect A B D D E E F G I J K L M N 0 P Q Count of Cost of Products Defect 217 0.17 67 0.89 18 5.12 23 4.89 112 1.89 43 4.23 1 Defect 2 Missing button 3 Loose thread 4 Misaligned fabric 5 Fabric flaws 6 Stitching errors 7 Hemming errors 8 9 10 11 12 13 14 15 16 17 18 19 20 21 22 23 24 25 26 27 Detect Data Measurement Data + Ready ICI DU + 150% AHH X 7 tv NO I ZA Excel File Edit View Insert Format Tools Data Window Help M103 8 9 8 6 a Thu Apr 7 11:11 AM ... AutoSave OFF UL Project 3_IME854_Spring2022 Home Insert Draw Page Layout Formulas Data Review View Tell me e Share Comments D2 fox D E F G . I LM N 0 P P Q A R S T U V w X Y Z A B C 1 Misalignment measurement in inches 2 Time Sequence Shift Shift 2 1 -0.5 0.21 4 2 2.47 1.04 5 5 3 2.54 1.11 f 4 2.91 0.27 7 5 3.13 5.27 g 3.29 4.01 9 7 1 1 0.41 10 8 3.4 0.83 11 9 3.82 12 10 3.89 7.21 13 11 3.9 0.35 14 12 3.91 1.01 15 13 3.95 2.62 16 14 4.13 0.62 17 15 4.2 1.91 18 16 0.5 2.76 19 17 4.32 4.13 20 19 1.3 2.21 21 19 5.5 1.08 22 20 5.8 1.55 1 23 21 5 0.94 24 22 5 0.56 25 23 7.5 2.92 26 24 5.00 1.19 27 25 5.18 4.58 28 26 5.66 2.45 29 22 5.88 1.31 30 28 5.95 1.63 31 29 5.01 1.15 32 30 6.00 0.97 33 31 5.24 5.34 E 34 32 5.34 0.06 35 33 6.39 2.79 36 34 2.6 3.51 37 35 8.35 0.2 32 39 40 41 42 43 Detect Data Measurement Data Ready ICI DU T TVUTO AHH X 7 tv s 9 T ili z A Excel File Edit View Insert Format Tools Data Window Help M103 6 Q R S a Thu Apr 7 11:11 AM ... AutoSave OFF 09 UL Project 3_IME854_Spring 2022 Home Insert Draw Page Layout Formulas Data Review View Tell me E Share Comments ci fx Cost of Defect A B D D E E F G I J K L M N 0 P Q Count of Cost of Products Defect 217 0.17 67 0.89 18 5.12 23 4.89 112 1.89 43 4.23 1 Defect 2 Missing button 3 Loose thread 4 Misaligned fabric 5 Fabric flaws 6 Stitching errors 7 Hemming errors 8 9 10 11 12 13 14 15 16 17 18 19 20 21 22 23 24 25 26 27 Detect Data Measurement Data + Ready ICI DU + 150% AHH X 7 tv NO I ZA Excel File Edit View Insert Format Tools Data Window Help M103 8 9 8 6 a Thu Apr 7 11:11 AM ... AutoSave OFF UL Project 3_IME854_Spring2022 Home Insert Draw Page Layout Formulas Data Review View Tell me e Share Comments D2 fox D E F G . I LM N 0 P P Q A R S T U V w X Y Z A B C 1 Misalignment measurement in inches 2 Time Sequence Shift Shift 2 1 -0.5 0.21 4 2 2.47 1.04 5 5 3 2.54 1.11 f 4 2.91 0.27 7 5 3.13 5.27 g 3.29 4.01 9 7 1 1 0.41 10 8 3.4 0.83 11 9 3.82 12 10 3.89 7.21 13 11 3.9 0.35 14 12 3.91 1.01 15 13 3.95 2.62 16 14 4.13 0.62 17 15 4.2 1.91 18 16 0.5 2.76 19 17 4.32 4.13 20 19 1.3 2.21 21 19 5.5 1.08 22 20 5.8 1.55 1 23 21 5 0.94 24 22 5 0.56 25 23 7.5 2.92 26 24 5.00 1.19 27 25 5.18 4.58 28 26 5.66 2.45 29 22 5.88 1.31 30 28 5.95 1.63 31 29 5.01 1.15 32 30 6.00 0.97 33 31 5.24 5.34 E 34 32 5.34 0.06 35 33 6.39 2.79 36 34 2.6 3.51 37 35 8.35 0.2 32 39 40 41 42 43 Detect Data Measurement Data Ready ICI DU T TVUTO AHH X 7 tv s 9 T ili z A
Step by Step Solution
There are 3 Steps involved in it

Get step-by-step solutions from verified subject matter experts