

Question: Please help me with this The following data represent the number of calories per serving and the number of gran Calories, x 250 230 150
Please help me with this
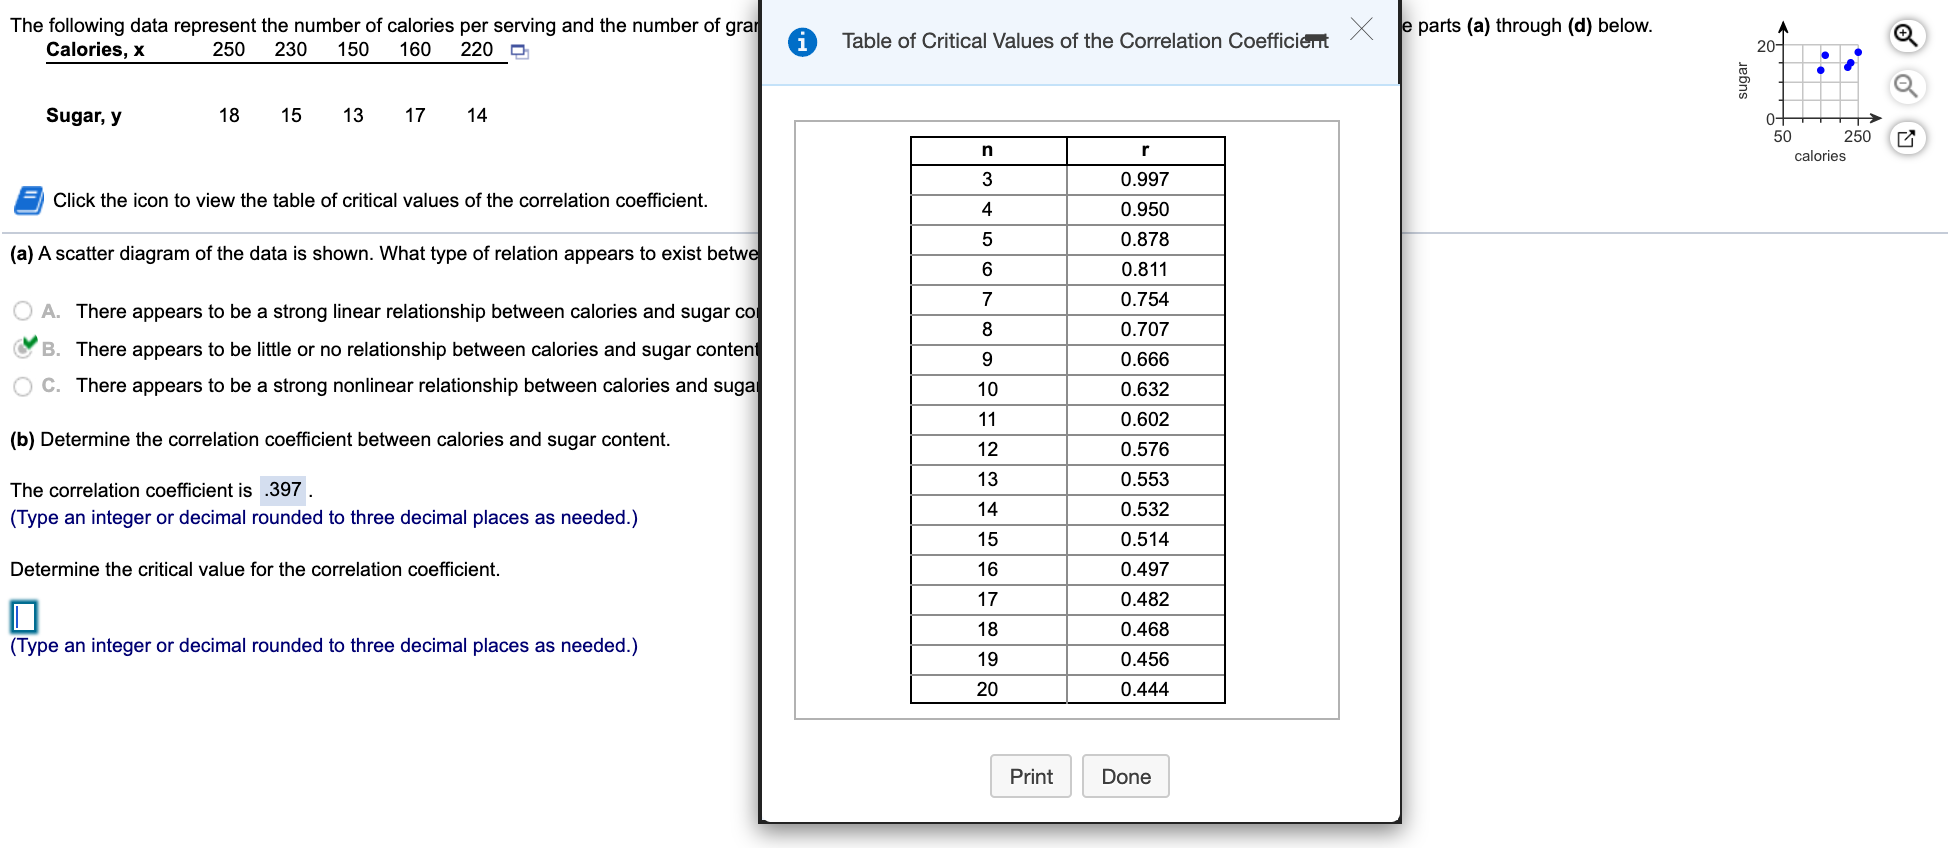
The following data represent the number of calories per serving and the number of gran Calories, x 250 230 150 160 220 i Table of Critical Values of the Correlation Coefficient X le parts (a) through (d) below. 0- sugar Sugar, y 18 15 13 17 14 50 r 250 n VOU A W calories 0.997 Click the icon to view the table of critical values of the correlation coefficient. 0.950 (a) A scatter diagram of the data is shown. What type of relation appears to exist betwe 0.878 0.811 O A. There appears to be a strong linear relationship between calories and sugar co 0.754 8 B. There appears to be little or no relationship between calories and sugar content 0.707 CO 0.666 O C. There appears to be a strong nonlinear relationship between calories and suga 10 0.632 11 0.602 (b) Determine the correlation coefficient between calories and sugar content. 12 0.576 The correlation coefficient is .397 . 13 0.553 (Type an integer or decimal rounded to three decimal places as needed.) 14 0.532 15 0.514 Determine the critical value for the correlation coefficient. 16 0.497 17 0.482 (Type an integer or decimal rounded to three decimal places as needed.) 18 0.468 19 0.456 20 0.444 Print Done
Step by Step Solution
There are 3 Steps involved in it

Get step-by-step solutions from verified subject matter experts