

Question: Please help me with those 2 problems. Thanks a lot. Ex 2,3 Econ 221 P51 Fall 2023 cl. On the graph, label the two price
Please help me with those 2 problems. Thanks a lot. Ex 2,3
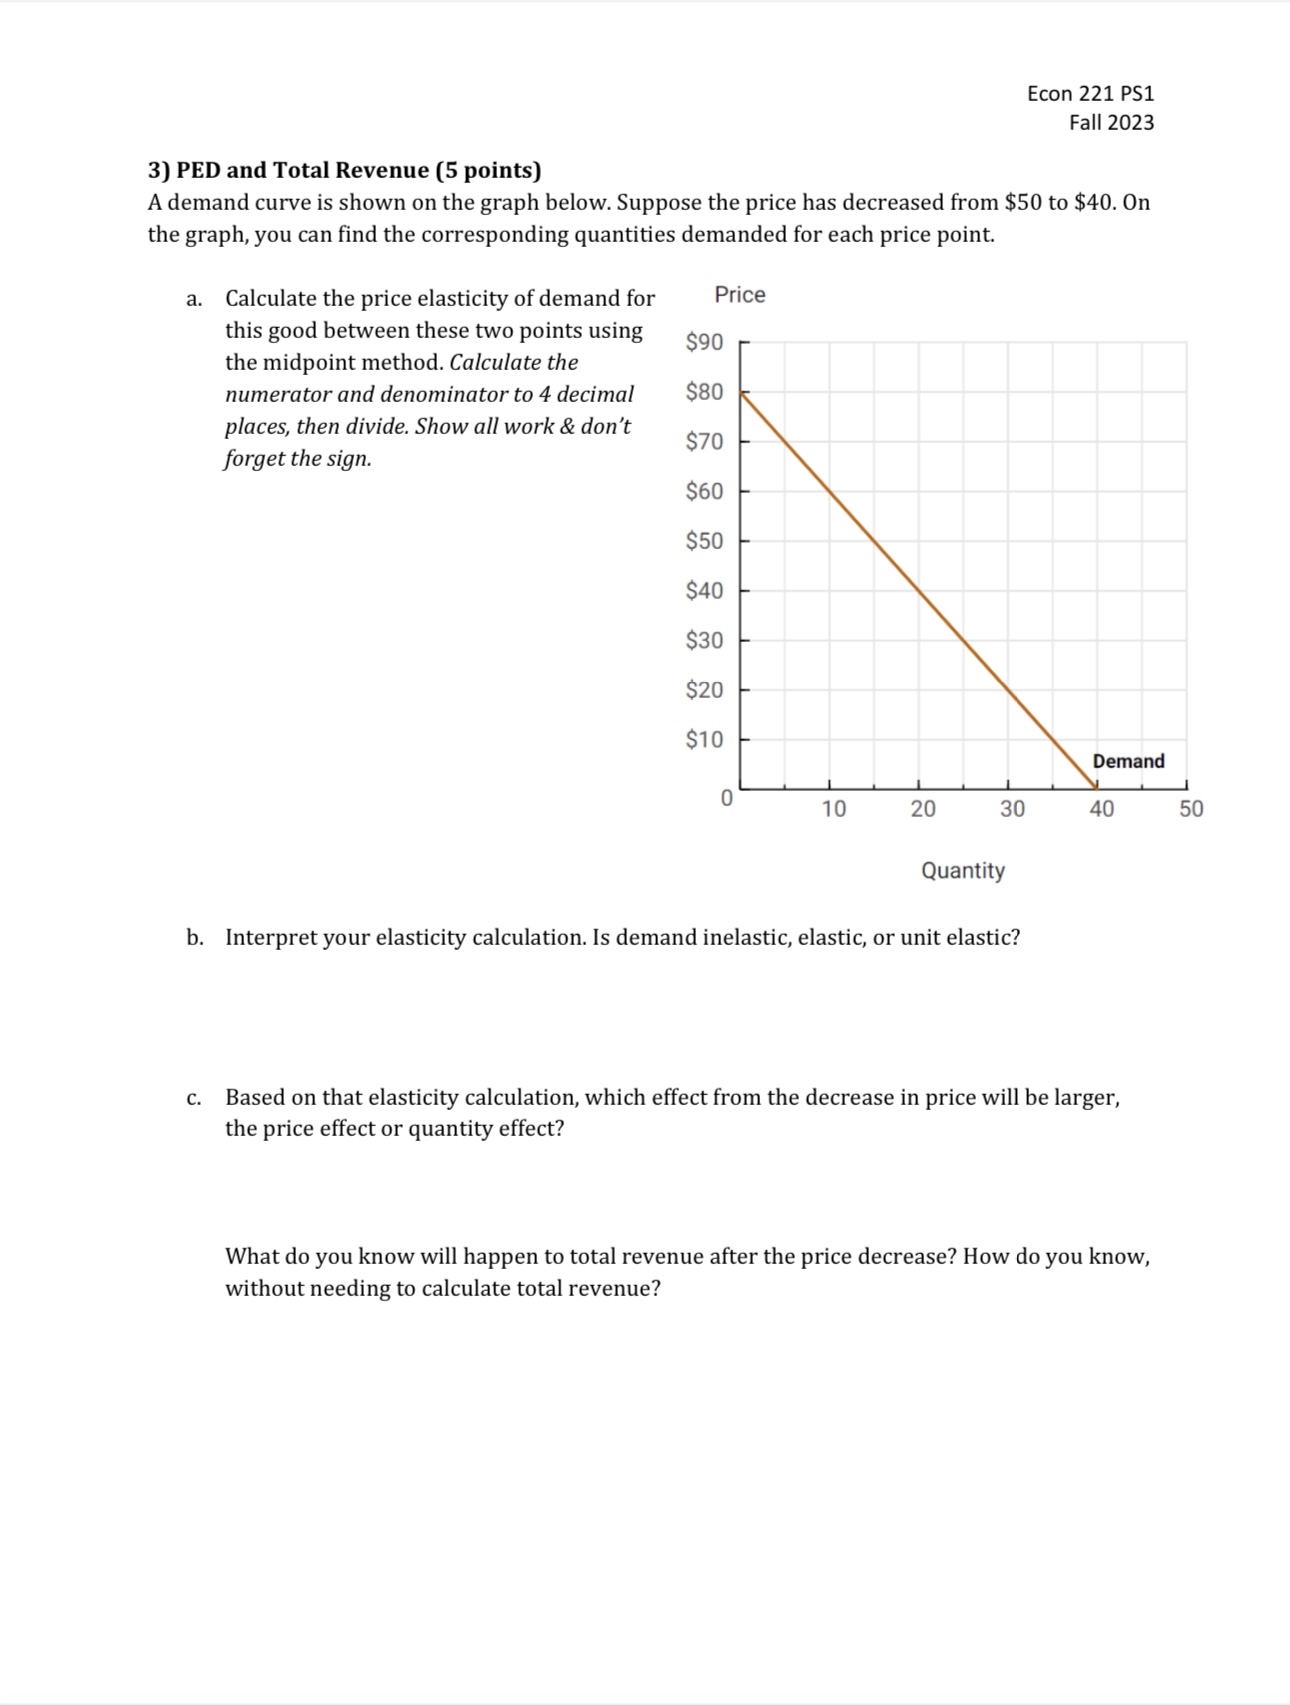
Econ 221 P51 Fall 2023 cl. On the graph, label the two price points and their corresponding quantities demanded, which outline the rectangles representing total revenue before and after the price change. Identify and label the smaller rectangles representing the price effect and quantity effect as price changes from $50 to $40. Which effect is larger? Does this match your answer from (c)? (Hint: You can use the squares on the graph to help determine which is larger] e. Check your answer to (d) by calculating the total revenue [P x Q) before and after the price change (at P=$50 and P=$40]. Verify that this conrms your answer from part (d). Econ 221 P51 Fall 2023 3) FEB and Total Revenue [5 points} A demand curve is shown on the graph below. Suppose the price has decreased from $50 to $40. On the graph, you can nd the corresponding quantities demanded for each price point. a. Calculate the price elasticity of demand for Price this good between these two points using 390 the midpoint method. Calculate the numerator and denominator to 4 decimal 380 places, then divide. Show all work 61: don't 70 forget the sign. 8 $60 $50 $40 $30 $20 $1 0 Demand 0 10 20 30 40 50 Quantity b. Interpret your elasticity calculation. ls demand inelastic, elastic, or unit elastic? c. Based on that elasticity calculation, which effect from the decrease in price will be larger, the price effect or quantity effect? What do you know will happen to total revenue after the price decrease? How do you know, without needing to calculate total revenue
Step by Step Solution
There are 3 Steps involved in it

Get step-by-step solutions from verified subject matter experts