

Question: please help me with those question. Thank you very much. i only can do question 9 Question 12 Complete Marked out of 1.00 risk aversion
please help me with those question. Thank you very much. i only can do question 9
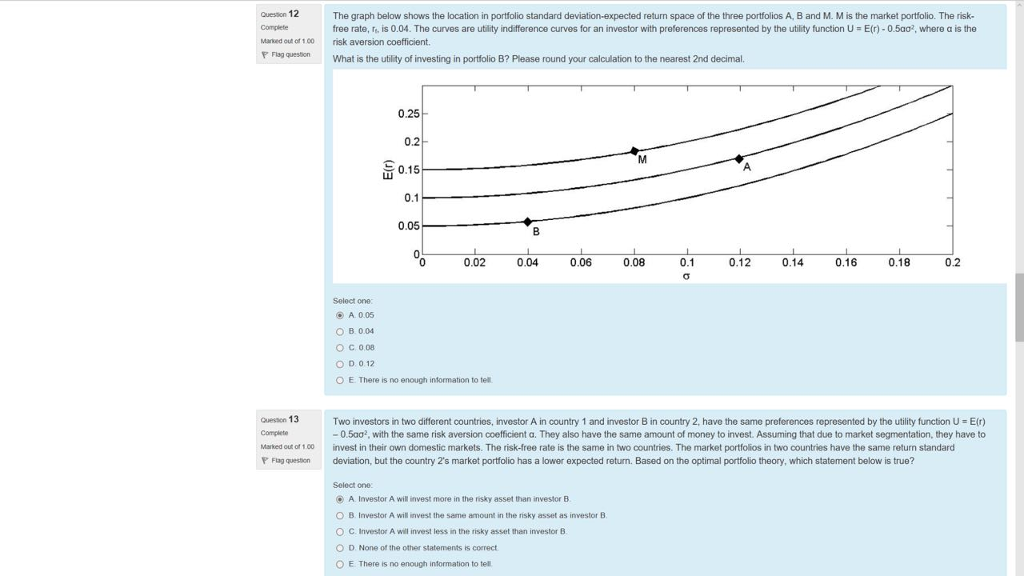
Question 12 Complete Marked out of 1.00 risk aversion coefficient. The graph below shows the location in portfolio standard deviation-expected return space of the three portfolios A, B and M. M is the market portfolio. The risk- free rate, re is 0.04. The curves are utility indifference curves for an investor with preferences represented by the utility function U = E(r)-0.5ao, where a is the Flag queston What is the utility of investing in portfolio B? Please round your calculation to the nearest 2nd decimal. 0.25 0.2 0.1 0.05 0.02 0.04 0.06 0.08 0.12 0.14 0.16 0.18 0.2 Select one A005 0B004 O C 0.08 O D 012 O E There is no enough intormation to tell Cuesson 13 Two investors in two different countries, investor A in country 1 and investor B in country 2, have the same preferences represented by tho utility function U E(r) -0.5 with the same risk aversion coefficient a They also have the same amount of money to invest. Assuming that due to market segmentation, they have to invest in their own domestic markets. The risk-free rate is the same in two countries. The market portfolios in two countries have the same return standard deviation, but the country 2's market portfolio has a lower expected return. Based on the optimal portfolio theory, which statement below is true? Marked out of 100 Flag question Select one A Investor A will invest more in the risky asset than investor B O B. Investor A will invest the same amount in the risky asset as investor B O C. Investor A will invest less in the risky asset than investor B O D. None of the other statements is correct O E. There is no enough information to tel Question 12 Complete Marked out of 1.00 risk aversion coefficient. The graph below shows the location in portfolio standard deviation-expected return space of the three portfolios A, B and M. M is the market portfolio. The risk- free rate, re is 0.04. The curves are utility indifference curves for an investor with preferences represented by the utility function U = E(r)-0.5ao, where a is the Flag queston What is the utility of investing in portfolio B? Please round your calculation to the nearest 2nd decimal. 0.25 0.2 0.1 0.05 0.02 0.04 0.06 0.08 0.12 0.14 0.16 0.18 0.2 Select one A005 0B004 O C 0.08 O D 012 O E There is no enough intormation to tell Cuesson 13 Two investors in two different countries, investor A in country 1 and investor B in country 2, have the same preferences represented by tho utility function U E(r) -0.5 with the same risk aversion coefficient a They also have the same amount of money to invest. Assuming that due to market segmentation, they have to invest in their own domestic markets. The risk-free rate is the same in two countries. The market portfolios in two countries have the same return standard deviation, but the country 2's market portfolio has a lower expected return. Based on the optimal portfolio theory, which statement below is true? Marked out of 100 Flag question Select one A Investor A will invest more in the risky asset than investor B O B. Investor A will invest the same amount in the risky asset as investor B O C. Investor A will invest less in the risky asset than investor B O D. None of the other statements is correct O E. There is no enough information to tel
Step by Step Solution
There are 3 Steps involved in it

Get step-by-step solutions from verified subject matter experts