

Question: please help me write: Experiment Summary ( Highlight the best classification model discovered.Describe how the best classification models were determined.Be sure to use the analysis
please help me write: Experiment Summary (Highlight the best classification model discovered.Describe how the best classification models were determined.Be sure to use the analysis skills learned from the data mining assignment).
Run1 (all parameters are included)
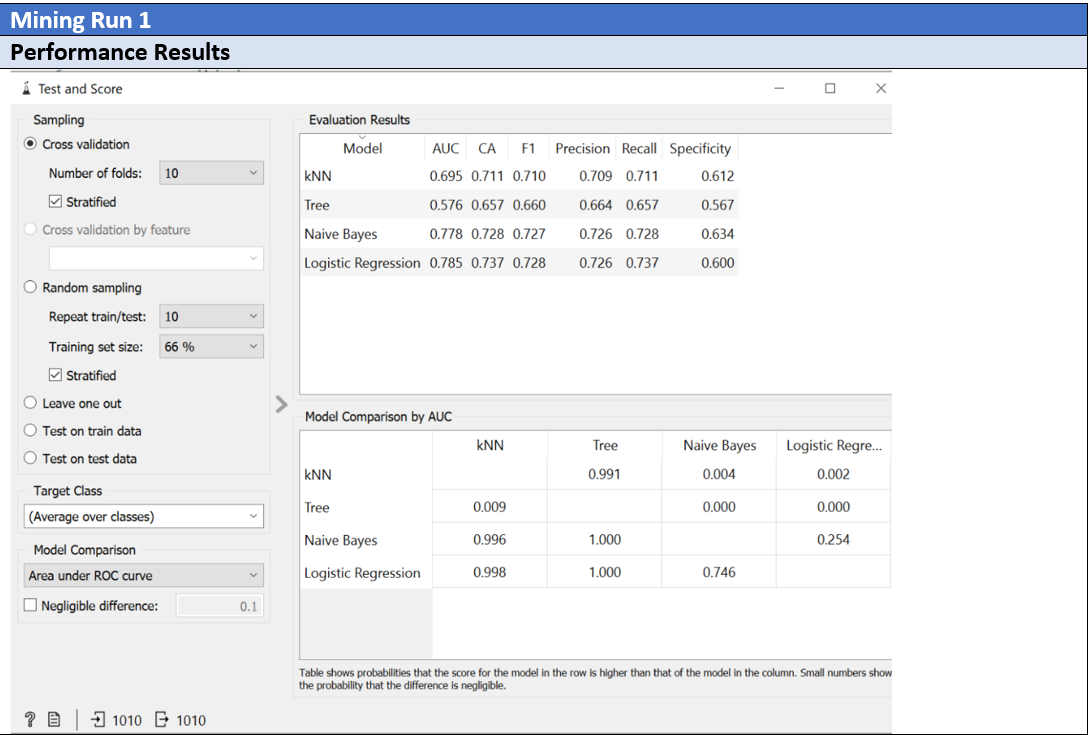
Mining Run 1 Performance Results Test and Score 0 X Sampling Evaluation Results O Cross validation Model AUC CA F1 Precision Recall Specificity Number of folds: 10 KNN 0.695 0.711 0.710 0.709 0.711 0.612 Stratified Tree 0.576 0.657 0.660 0.664 0.657 0.567 O Cross validation by feature Naive Bayes 0.778 0.728 0.727 0.726 0.728 0.634 Logistic Regression 0.785 0.737 0.728 0.726 0.737 0.600 O Random sampling Repeat train/test: 10 Training set size: 66 % Stratified O Leave one out > Model Comparison by AUC O Test on train data KNN Tree Naive Bayes Logistic Regre... O Test on test data KNN 0.991 0.004 0.002 Target Class Tree 0.009 0.000 0.000 (Average over classes) Naive Bayes 0.996 1.000 0.254 Model Comparison Area under ROC curve Logistic Regression 0.998 1.000 0.746 Negligible difference: 0.1 Table shows probabilities that the score for the model in the row is higher than that of the model in the column. Small numbers show the probability that the difference is negligible. ? 1010 1010Test and Score X Sampling Evaluation Results O Cross validation Model AUC CA F1 Precision Recall Specificity Number of folds: 10 KNN 0.596 0.649 0.632 0.624 0.649 0.465 Stratified Tree 0.542 0.587 0.592 0.599 0.587 0.484 Cross validation by feature Naive Bayes 0.680 0.691 0.674 0.670 0.691 0.513 Logistic Regression 0.680 0.695 0.667 0.668 0.695 0.483 Random sampling Repeat train/test: 10 Training set size: 66 % Stratified O Leave one out Model Comparison by AUC O Test on train data KNN Tree Naive Bayes Logistic Regre... O Test on test data KNN 0.926 0.014 0.009 Target Class Tree 0.074 0.000 0.000 (Average over classes) Naive Bayes 0.986 1.000 0.497 Model Comparison Area under ROC curve Logistic Regression 0.991 1.000 0.503 Negligible difference: 0.1 Table shows probabilities that the score for the model in the row is higher than that of the model in the column. Small numbers show the probability that the difference is negligible. ? 8 1010 1010Test and Score X Sampling Evaluation Results O Cross validation Model AUC CA F1 Precision Recall Specificity Number of folds: 10 KNN 0.590 0.645 0.624 0.615 0.645 0.447 Stratified Tree 0.529 0.589 0.596 0.605 0.589 0.497 Cross validation by feature Naive Bayes 0.673 0.689 0.670 0.666 0.689 0.502 Logistic Regression 0.677 0.694 0.665 0.666 0.694 0.479 O Random sampling Repeat train/test: 10 Training set size: 66% Stratified O Leave one out Model Comparison by AUC O Test on train data KNN Tree Naive Bayes Logistic Regre... O Test on test data KNN 0.938 0.006 0.003 Target Class Tree 0.062 0.000 0.000 (Average over classes) Naive Bayes 0.994 1.000 0.450 Model Comparison Area under ROC curve Logistic Regression 0.997 1.000 0.550 Negligible difference: 0.1 Table shows probabilities that the score for the model in the row is higher than that of the model in the column. Small numbers show the probability that the difference is negligible. ? 1010 - 1010
Step by Step Solution
There are 3 Steps involved in it

Get step-by-step solutions from verified subject matter experts