Question: please help Minitab - Untitled ile Edit Data Calc Stat Graph Editor Tools Window Help ee 1A ?CGG El Session $ Of Row Pearson Chi-Square
please help
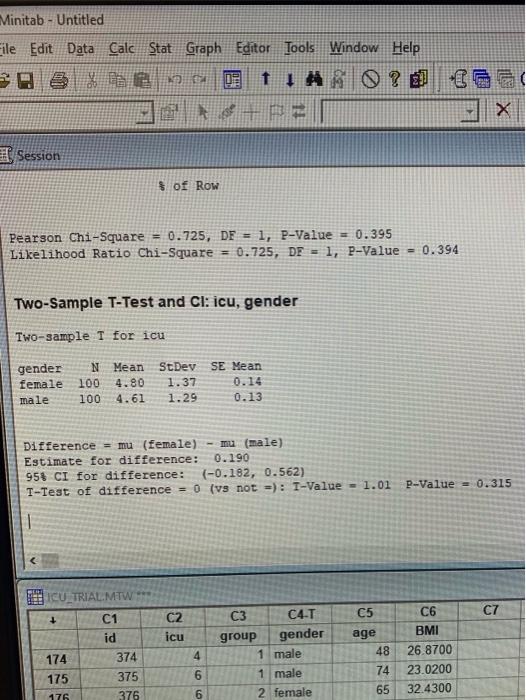
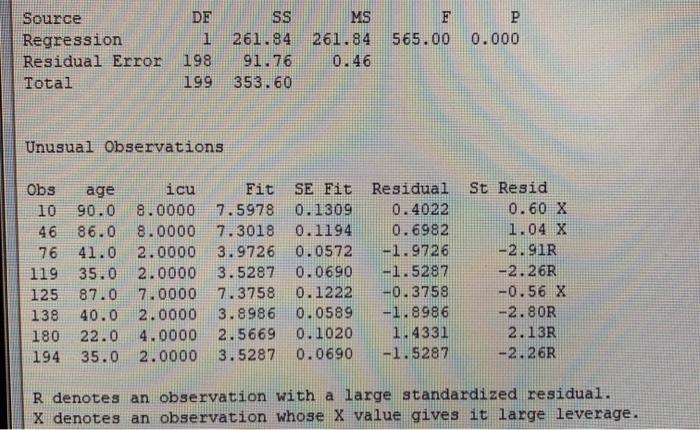
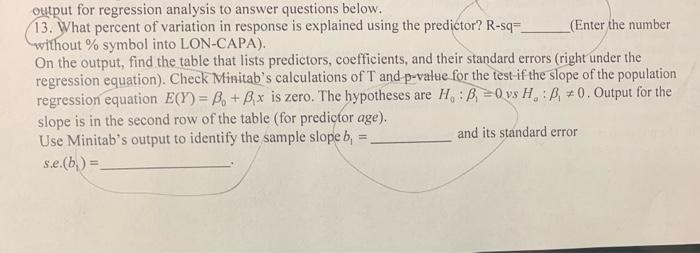
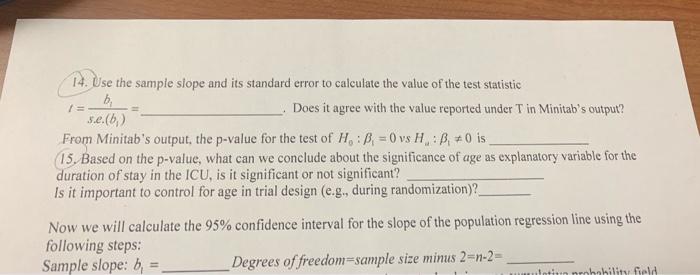
Minitab - Untitled ile Edit Data Calc Stat Graph Editor Tools Window Help ee 1A ?CGG El Session $ Of Row Pearson Chi-Square = 0.725, DF = 1, P-Value = 0.395 Likelihood Ratio Chi-Square = 0.725, DF = 1, P-Value = 0.394 TWO-Sample T-Test and Cl: icu, gender Two-sample T for icu gender female male N Mean 100 4.80 100 4.61 StDev SE Mean 1.37 0.14 1.29 0.13 Difference = mu (female) - mu (male) Estimate for difference: 0.190 95% CI for difference: (-0.182, 0.562) T-Test of difference = 0 (vs not =): T-Value = 1.01 P-Value = 0.315 ICU TRIAL.MTW C5 C6 C7 + C1 id 374 C2 icu 174 4 C3 C4-T group gender 1 male 1 male 2 female age 48 74 65 BMI 26.8700 23.0200 32.4300 175 375 6 176 376 6 SS Source Regression Residual Error Total F P 565.000.000 DE 1 198 199 MS 261.84 0.46 261.84 91.76 353.60 Unusual Observations Obs age icu Fit 10 90.0 8.0000 7.5978 46 86.0 8.00 7.3018 76 41.0 2. 0000 3.9726 119 35.0 2.0000 3.5287 125 87.0 7.0000 7.3758 138 40.0 2.0000 3.8986 180 22.0 4.0000 2.5669 194 35.0 2.0000 3.5287 SE Fit Residual 0.1309 0.4022 0.1194 0.6982 0.0572 -1.9726 0.0690 -1.5287 0.1222 -0.3758 0.0589 -1.8986 0.1020 1.4331 0.0690 -1.5287 St Resid 0.60 X 1.04 X -2.91R -2.26R -0.56 x -2.80R 2.13R -2.26R R denotes an observation with a large standardized residual. X denotes an observation whose X value gives it large leverage. output for regression analysis to answer questions below. 13. What percent of variation in response is explained using the predictor? R-sq=- (Enter the number without % symbol into LON-CAPA). On the output, find the table that lists predictors, coefficients, and their standard errors (right under the regression equation). Check Minitab's calculations of T and p-value for the test if the slope of the population regression equation E(Y) = B. + Bx is zero. The hypotheses are H :B, = 0 vs HB, +0. Output for the slope is in the second row of the table (for predictor age). Use Minitab's output to identify the sample slope b, = and its standard error s.e.(b) = 14. Use the sample slope and its standard error to calculate the value of the test statistic b Does it agree with the value reported under T in Minitab's output? 5.e.(6) From Minitab's output, the p-value for the test of H:8, = 0 vs H :B #0 is 15. Based on the p-value, what can we conclude about the significance of age as explanatory variable for the duration of stay in the ICU, is it significant or not significant? Is it important to control for age in trial design (e.g., during randomization)? Now we will calculate the 95% confidence interval for the slope of the population regression line using the following steps: Sample slope: b = Degrees of freedom=sample size minus 2=n-2= wintinin nrobability field Minitab - Untitled ile Edit Data Calc Stat Graph Editor Tools Window Help ee 1A ?CGG El Session $ Of Row Pearson Chi-Square = 0.725, DF = 1, P-Value = 0.395 Likelihood Ratio Chi-Square = 0.725, DF = 1, P-Value = 0.394 TWO-Sample T-Test and Cl: icu, gender Two-sample T for icu gender female male N Mean 100 4.80 100 4.61 StDev SE Mean 1.37 0.14 1.29 0.13 Difference = mu (female) - mu (male) Estimate for difference: 0.190 95% CI for difference: (-0.182, 0.562) T-Test of difference = 0 (vs not =): T-Value = 1.01 P-Value = 0.315 ICU TRIAL.MTW C5 C6 C7 + C1 id 374 C2 icu 174 4 C3 C4-T group gender 1 male 1 male 2 female age 48 74 65 BMI 26.8700 23.0200 32.4300 175 375 6 176 376 6 SS Source Regression Residual Error Total F P 565.000.000 DE 1 198 199 MS 261.84 0.46 261.84 91.76 353.60 Unusual Observations Obs age icu Fit 10 90.0 8.0000 7.5978 46 86.0 8.00 7.3018 76 41.0 2. 0000 3.9726 119 35.0 2.0000 3.5287 125 87.0 7.0000 7.3758 138 40.0 2.0000 3.8986 180 22.0 4.0000 2.5669 194 35.0 2.0000 3.5287 SE Fit Residual 0.1309 0.4022 0.1194 0.6982 0.0572 -1.9726 0.0690 -1.5287 0.1222 -0.3758 0.0589 -1.8986 0.1020 1.4331 0.0690 -1.5287 St Resid 0.60 X 1.04 X -2.91R -2.26R -0.56 x -2.80R 2.13R -2.26R R denotes an observation with a large standardized residual. X denotes an observation whose X value gives it large leverage. output for regression analysis to answer questions below. 13. What percent of variation in response is explained using the predictor? R-sq=- (Enter the number without % symbol into LON-CAPA). On the output, find the table that lists predictors, coefficients, and their standard errors (right under the regression equation). Check Minitab's calculations of T and p-value for the test if the slope of the population regression equation E(Y) = B. + Bx is zero. The hypotheses are H :B, = 0 vs HB, +0. Output for the slope is in the second row of the table (for predictor age). Use Minitab's output to identify the sample slope b, = and its standard error s.e.(b) = 14. Use the sample slope and its standard error to calculate the value of the test statistic b Does it agree with the value reported under T in Minitab's output? 5.e.(6) From Minitab's output, the p-value for the test of H:8, = 0 vs H :B #0 is 15. Based on the p-value, what can we conclude about the significance of age as explanatory variable for the duration of stay in the ICU, is it significant or not significant? Is it important to control for age in trial design (e.g., during randomization)? Now we will calculate the 95% confidence interval for the slope of the population regression line using the following steps: Sample slope: b = Degrees of freedom=sample size minus 2=n-2= wintinin nrobability field