

Question: please help must be in python 2. The function scipy.stats.linregress(x,y) performs a linear regression of y on s. It returns five values: the slope, intercept,
please help must be in python
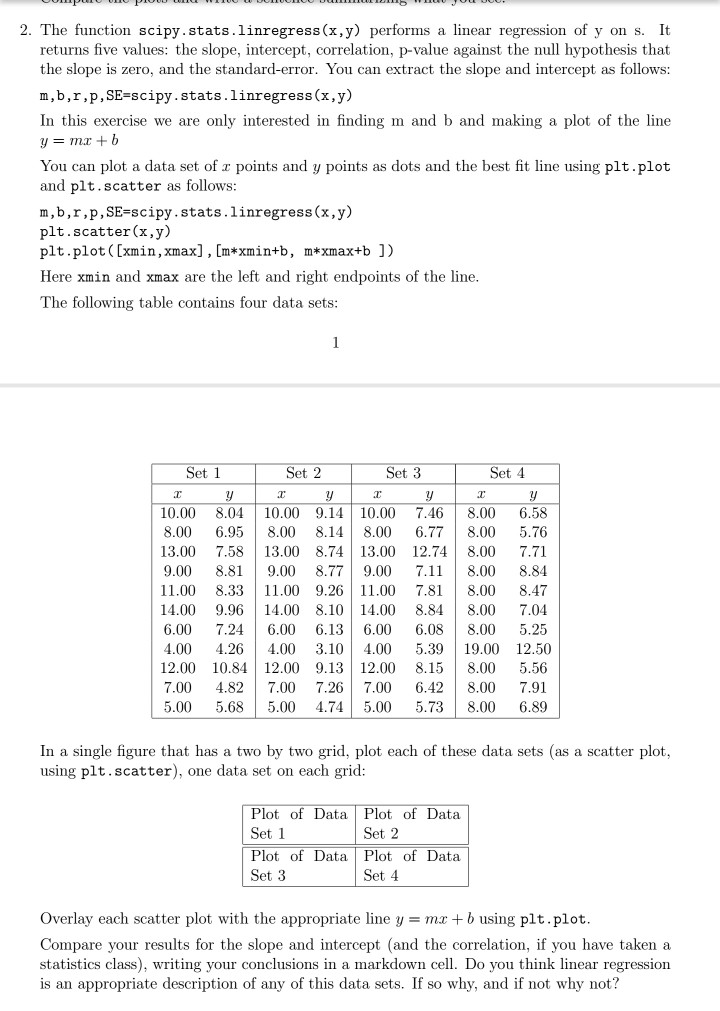
2. The function scipy.stats.linregress(x,y) performs a linear regression of y on s. It returns five values: the slope, intercept, correlation, p-value against the null hypothesis that the slope is zero, and the standard-error. You can extract the slope and intercept as follows m, b, r, p, SE-scipy. stats. Inregress(x,y) In this exercise we are only interested in finding m and b and making a plot of the line y=mx + b You can plot a data set of r points and y points as dots and the best fit line using plt.plot and plt.scatter as follows: m,b,r,p, SE-scipy.stats.linregress (x,y) plt.scatter(x,y) plt, plot( [xmin, xmax], [m* xmin+b, m#xmax+D ]) Here xmin and xmax are the left and right endpoints of the line The following table contains four data sets: Set 2 Set 3 Set 4 10.00 8.04 10.00 9.14 10.00 7.46 8.00 6.58 8.00 6.95 8.00 8.14 8.00 6.77 8.00 5.76 13.00 7.5813.00 8.74 13.00 12.74 8.00 7.71 9.008.81 9.00 8.77 9.00 7.1 8.00 8.84 11.00 8.33 11.00 9.26 11.00 7.81 8.00 8.47 14.00 9.9614.00 8.10 14.00 8.84 8.00 7.04 6.00 7.246.00 6.13 6.00 6.08 8.00 5.25 4.00 4.26 4.00 3.10 4.00 5.39 19.00 12.50 12.00 10.84 12.00 9.13 12.00 8.15 8.00 5.56 7.00 4.82 7.00 7.26 7.00 6.42 8.00 7.91 5.00 5.68 5.00 4.74 5.00 5.73 8.00 6.89 In a single figure that has a two by two grid, plot each of these data sets (as a scatter plot, using plt.scatter), one data set on each grid Plot of Data Plot of Data Set 1 Plot of Data Plot of Data Set 3 Set 2 Set 4 Overlay each scatter plot with the appropriate line y mxb using plt.plot Compare your results for the slope and intercept (and the correlation, if you have taken a statistics class), writing your conclusions in a markdown cell. Do you think linear regression is an appropriate description of any of this data sets. If so why, and if not why not
Step by Step Solution
There are 3 Steps involved in it

Get step-by-step solutions from verified subject matter experts