

Question: PLEASE HELP! My team is currently in our 4th round of Capism simulation and we bit off more then we can chew. I believe that
PLEASE HELP! My team is currently in our 4th round of Capism simulation and we bit off more then we can chew. I believe that we borrowed too much and have had to take out a huge emergency loan. Is there any suggested course of action we can take to just keep our heads above water?
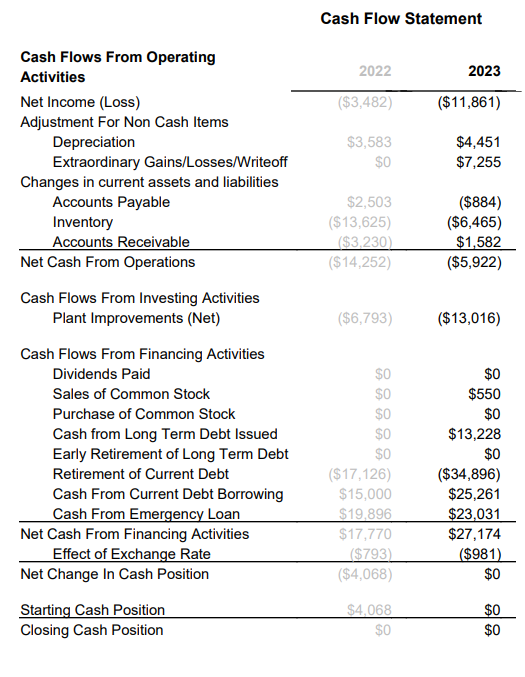
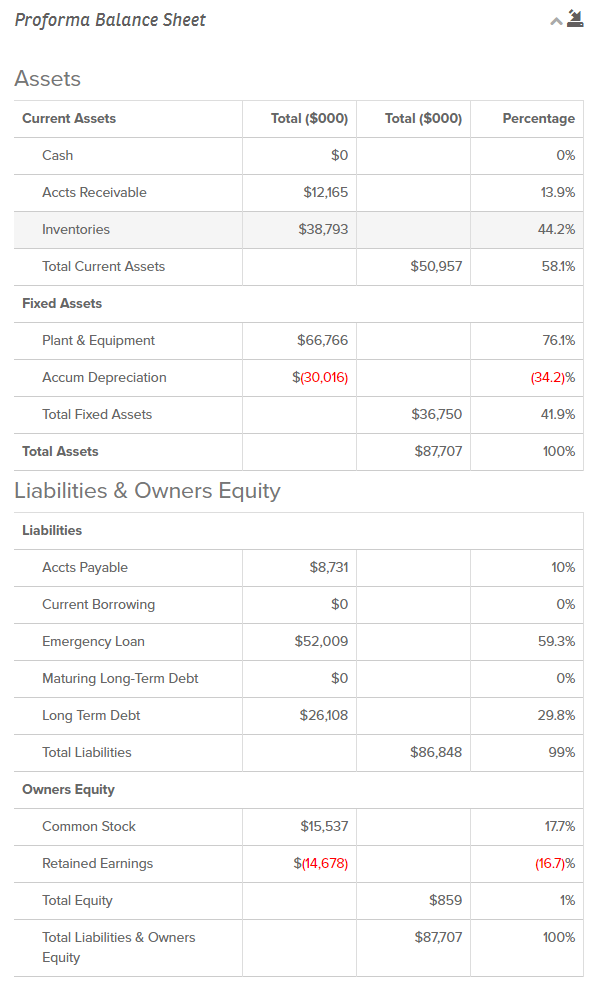
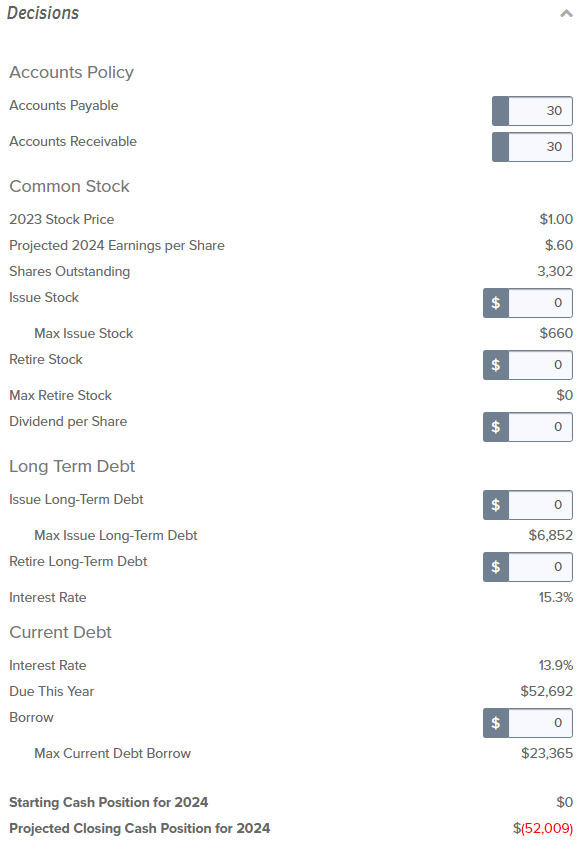
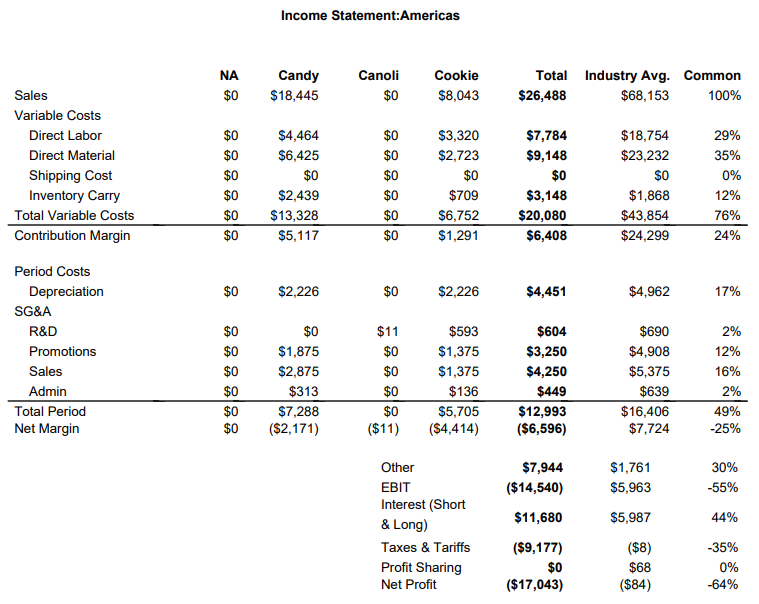
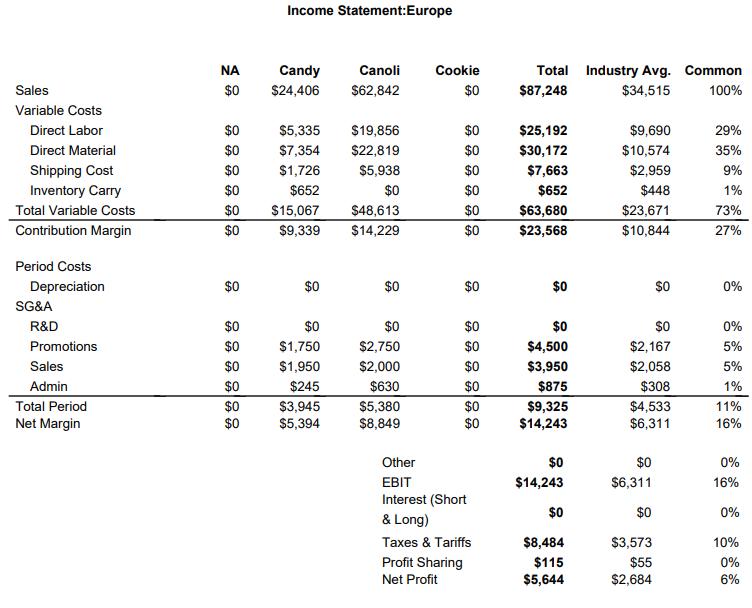
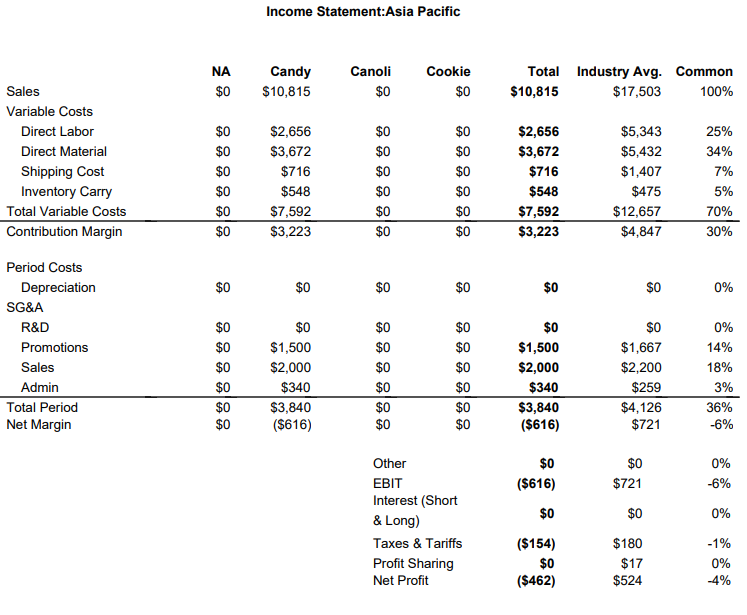
Cash Flow Statement Cash Flows From Operating 2022 2023 Activities Net Income (Loss) Adjustment For Non Cash Items Depreciation Extraordinary Gains/Losses/Writeoff Changes in current assets and liabilities Accounts Payable Inventory Accounts Receivable Net Cash From Operations ($3,482) ($11,861) $3,583 $4,451 $0 $7,255 $2,503 ($13,625) ($884) ($6,465) $1.582 ($5,922) ($3,230) ($14,252) Cash Flows From Investing Activities Plant Improvements (Net) ($6,793) ($13,016) Cash Flows From Financing Activities Dividends Paid $0 $0 Sales of Common Stock $0 $550 Purchase of Common Stock $0 $0 Cash from Long Term Debt Issued Early Retirement of Long Term Debt $0 $13,228 $0 $0 ($17,126) Retirement of Current Debt ($34,896) $25,261 Cash From Current Debt Borrowing Cash From Emergency Loan Net Cash From Financing Activities Effect of Exchange Rate Net Change In Cash Position $15,000 $19,896 $23,031 $27,174 $17,770 ($981) $0 ($793) ($4,068) Starting Cash Position Closing Cash Position $4,068 $0 $0 Proforma Balance Sheet Assets Total ($000) Total ($000) Current Assets Percentage $0 Cash 0% $12,165 Accts Receivable 13.9% $38,793 44.2% Inventories $50,957 58.1% Total Current Assets Fixed Assets Plant & Equipment $66,766 76.1% Accum Depreciation $(30,016) (34.2)% Total Fixed Assets $36,750 41.9% $87,707 100% Total Assets Liabilities&Owners Equity Liabilities $8.731 10% Accts Payable $0 0% Current Borrowing $52,009 59.3% Emergency Loan $0 Maturing Long-Term Debt 0% $26,108 Long Term Debt 29.8% $86,848 99% Total Liabilities Owners Equity $15,537 Common Stock 17.7% Retained Earnings $(14,678) (16.7)% Total Equity $859 1% $87,707 Total Liabilities & Owners 100% Equity Decisions Accounts Policy Accounts Payable 30 Accounts Receivable Common Stock 2023 Stock Price $1.00 $.60 Projected 2024 Earnings per Share Shares Outstanding 3,302 Issue Stock $ Max Issue Stock 099$ Retire Stock 0 $0 Max Retire Stock Dividend per Share 0 Long Term Debt Issue Long-Term Debt 0 $6,852 Max Issue Long-Term Debt Retire Long-Term Debt 15.3% Interest Rate Current Debt Interest Rate 13.9% $52,692 Due This Year Borrow $ 0 $23,365 Max Current Debt Borrow $0 Starting Cash Position for 2024 $(52,009) Projected Closing Cash Position for 2024 30 tA tA tA A +A Income Statement:Americas Candy NA Canoli Cookie Total Industry Avg. Common $26,488 $18,445 Sales $0 $0 $8,043 $68,153 100% Variable Costs Direct Labor $0 $4,464 $0 $3,320 $7,784 $18,754 29% $6,425 Direct Material $0 $2,723 $9,148 $23,232 35% Shipping Cost $0 $0 $0 $0 $0 $0 0% Inventory Carry $0 $2,439 $0 $709 $3,148 $1,868 12% $13,328 $6,752 Total Variable Costs $0 $0 $20,080 $43,854 76% Contribution Margin $0 $5,117 $0 $1,291 $6,408 $24,299 24% Period Costs Depreciation $0 $2,226 $0 $2,226 $4,451 $4,962 17% SG&A R&D $0 $0 $11 $593 $604 $690 2% $1,875 $3,250 Promotions $0 $0 $1,375 $4,908 12% Sales $0 $2,875 $0 $1,375 $4,250 $5,375 16% Admin $0 $313 $136 $449 $639 2% Total Period $0 $7,288 ($2,171) $0 $5,705 ($4,414) $12,993 ($6,596) $16,406 $7,724 49% Net Margin $0 ($11) 25% $7,944 Other $1,761 30% EBIT ($14,540) $5,963 -55% Interest (Short $11,680 $5,987 44% & Long) Taxes & Tariffs ($9,177) ($8) -35% Profit Sharing $0 $68 0% ($17,043) Net Profit ($84) -64% Income Statement:Europe Candy Canoli Cookie NA Total Industry Avg. Common Sales $0 $24,406 $62,842 $0 $87,248 $34,515 100% Variable Costs $5,335 29% Direct Labor $0 $19,856 $0 $25,192 $9,690 Direct Material $0 $7,354 $22,819 $0 $30,172 $10,574 35% Shipping Cost Inventory Carry $0 $0 $1,726 $5,938 $7,663 $2,959 9% $0 $652 $0 $0 $652 $448 1% $0 $23,671 73% Total Variable Costs $0 $15,067 $48,613 $63,680 Contribution Margin $0 $9,339 $14,229 $0 $23,568 $10,844 27% Period Costs 0% Depreciation $0 $0 $0 $0 $0 $0 SG&A $0 R&D $0 $0 $0 $0 $0 0% Promotions $0 $1,750 $2,750 $0 $4,500 $2,167 5% Sales $0 $1,950 $2,000 $0 $3,950 $2,058 5% Admin $0 $245 $630 $0 $875 $308 1% Total Period $0 $0 $3,945 $5,394 $5,380 $8,849 $0 $9,325 $14,243 $4,533 $6,311 11% Net Margin $0 16% Other $0 $0 0% EBIT $14,243 $6,311 16% Interest (Short & Long) $0 $0 0% $8,484 Taxes & Tariffs $3,573 10% Profit Sharing $115 $55 0% $2,684 Net Profit $5,644 6% Income Statement:Asia Pacific NA Candy Canoli Cookie Total Industry Avg. Common Sales $0 $10,815 $0 $0 $10,815 $17,503 100% Variable Costs $5,343 Direct Labor $0 $2,656 $0 $0 $2,656 25% Direct Material $0 $3,672 $0 $0 $3,672 $5,432 34% Shipping Cost $0 $716 $0 $0 $716 $1,407 7% Inventory Carry $0 $548 $0 $0 $548 $475 5% Total Variable Costs $0 $7,592 $0 $0 $7,592 $12,657 70% Contribution Margin $3,223 $0 $0 $3,223 $4,847 Period Costs Depreciation $0 $0 $0 $0 $0 0% SG&A R&D $0 $0 $0 $0 $0 $0 0% $1,500 Promotions $0 $0 $0 $1,500 $1,667 14% Sales $0 $2,000 $0 $0 $2,000 $2,200 18% Admin $0 $340 $0 $0 $340 $259 3% $3,840 ($616) Total Period $0 $0 $0 $3,840 ($616) $4,126 $721 36% Net Margin $0 $0 $0 -6% Other $0 $0 0% EBIT ($616) $721 -6% Interest (Short $0 $0 0% & Long) Taxes & Tariffs ($154) $180 -1% Profit Sharing Net Profit $0 $17 0% ($462) $524 -4% $30 Cash Flow Statement Cash Flows From Operating 2022 2023 Activities Net Income (Loss) Adjustment For Non Cash Items Depreciation Extraordinary Gains/Losses/Writeoff Changes in current assets and liabilities Accounts Payable Inventory Accounts Receivable Net Cash From Operations ($3,482) ($11,861) $3,583 $4,451 $0 $7,255 $2,503 ($13,625) ($884) ($6,465) $1.582 ($5,922) ($3,230) ($14,252) Cash Flows From Investing Activities Plant Improvements (Net) ($6,793) ($13,016) Cash Flows From Financing Activities Dividends Paid $0 $0 Sales of Common Stock $0 $550 Purchase of Common Stock $0 $0 Cash from Long Term Debt Issued Early Retirement of Long Term Debt $0 $13,228 $0 $0 ($17,126) Retirement of Current Debt ($34,896) $25,261 Cash From Current Debt Borrowing Cash From Emergency Loan Net Cash From Financing Activities Effect of Exchange Rate Net Change In Cash Position $15,000 $19,896 $23,031 $27,174 $17,770 ($981) $0 ($793) ($4,068) Starting Cash Position Closing Cash Position $4,068 $0 $0 Proforma Balance Sheet Assets Total ($000) Total ($000) Current Assets Percentage $0 Cash 0% $12,165 Accts Receivable 13.9% $38,793 44.2% Inventories $50,957 58.1% Total Current Assets Fixed Assets Plant & Equipment $66,766 76.1% Accum Depreciation $(30,016) (34.2)% Total Fixed Assets $36,750 41.9% $87,707 100% Total Assets Liabilities&Owners Equity Liabilities $8.731 10% Accts Payable $0 0% Current Borrowing $52,009 59.3% Emergency Loan $0 Maturing Long-Term Debt 0% $26,108 Long Term Debt 29.8% $86,848 99% Total Liabilities Owners Equity $15,537 Common Stock 17.7% Retained Earnings $(14,678) (16.7)% Total Equity $859 1% $87,707 Total Liabilities & Owners 100% Equity Decisions Accounts Policy Accounts Payable 30 Accounts Receivable Common Stock 2023 Stock Price $1.00 $.60 Projected 2024 Earnings per Share Shares Outstanding 3,302 Issue Stock $ Max Issue Stock 099$ Retire Stock 0 $0 Max Retire Stock Dividend per Share 0 Long Term Debt Issue Long-Term Debt 0 $6,852 Max Issue Long-Term Debt Retire Long-Term Debt 15.3% Interest Rate Current Debt Interest Rate 13.9% $52,692 Due This Year Borrow $ 0 $23,365 Max Current Debt Borrow $0 Starting Cash Position for 2024 $(52,009) Projected Closing Cash Position for 2024 30 tA tA tA A +A Income Statement:Americas Candy NA Canoli Cookie Total Industry Avg. Common $26,488 $18,445 Sales $0 $0 $8,043 $68,153 100% Variable Costs Direct Labor $0 $4,464 $0 $3,320 $7,784 $18,754 29% $6,425 Direct Material $0 $2,723 $9,148 $23,232 35% Shipping Cost $0 $0 $0 $0 $0 $0 0% Inventory Carry $0 $2,439 $0 $709 $3,148 $1,868 12% $13,328 $6,752 Total Variable Costs $0 $0 $20,080 $43,854 76% Contribution Margin $0 $5,117 $0 $1,291 $6,408 $24,299 24% Period Costs Depreciation $0 $2,226 $0 $2,226 $4,451 $4,962 17% SG&A R&D $0 $0 $11 $593 $604 $690 2% $1,875 $3,250 Promotions $0 $0 $1,375 $4,908 12% Sales $0 $2,875 $0 $1,375 $4,250 $5,375 16% Admin $0 $313 $136 $449 $639 2% Total Period $0 $7,288 ($2,171) $0 $5,705 ($4,414) $12,993 ($6,596) $16,406 $7,724 49% Net Margin $0 ($11) 25% $7,944 Other $1,761 30% EBIT ($14,540) $5,963 -55% Interest (Short $11,680 $5,987 44% & Long) Taxes & Tariffs ($9,177) ($8) -35% Profit Sharing $0 $68 0% ($17,043) Net Profit ($84) -64% Income Statement:Europe Candy Canoli Cookie NA Total Industry Avg. Common Sales $0 $24,406 $62,842 $0 $87,248 $34,515 100% Variable Costs $5,335 29% Direct Labor $0 $19,856 $0 $25,192 $9,690 Direct Material $0 $7,354 $22,819 $0 $30,172 $10,574 35% Shipping Cost Inventory Carry $0 $0 $1,726 $5,938 $7,663 $2,959 9% $0 $652 $0 $0 $652 $448 1% $0 $23,671 73% Total Variable Costs $0 $15,067 $48,613 $63,680 Contribution Margin $0 $9,339 $14,229 $0 $23,568 $10,844 27% Period Costs 0% Depreciation $0 $0 $0 $0 $0 $0 SG&A $0 R&D $0 $0 $0 $0 $0 0% Promotions $0 $1,750 $2,750 $0 $4,500 $2,167 5% Sales $0 $1,950 $2,000 $0 $3,950 $2,058 5% Admin $0 $245 $630 $0 $875 $308 1% Total Period $0 $0 $3,945 $5,394 $5,380 $8,849 $0 $9,325 $14,243 $4,533 $6,311 11% Net Margin $0 16% Other $0 $0 0% EBIT $14,243 $6,311 16% Interest (Short & Long) $0 $0 0% $8,484 Taxes & Tariffs $3,573 10% Profit Sharing $115 $55 0% $2,684 Net Profit $5,644 6% Income Statement:Asia Pacific NA Candy Canoli Cookie Total Industry Avg. Common Sales $0 $10,815 $0 $0 $10,815 $17,503 100% Variable Costs $5,343 Direct Labor $0 $2,656 $0 $0 $2,656 25% Direct Material $0 $3,672 $0 $0 $3,672 $5,432 34% Shipping Cost $0 $716 $0 $0 $716 $1,407 7% Inventory Carry $0 $548 $0 $0 $548 $475 5% Total Variable Costs $0 $7,592 $0 $0 $7,592 $12,657 70% Contribution Margin $3,223 $0 $0 $3,223 $4,847 Period Costs Depreciation $0 $0 $0 $0 $0 0% SG&A R&D $0 $0 $0 $0 $0 $0 0% $1,500 Promotions $0 $0 $0 $1,500 $1,667 14% Sales $0 $2,000 $0 $0 $2,000 $2,200 18% Admin $0 $340 $0 $0 $340 $259 3% $3,840 ($616) Total Period $0 $0 $0 $3,840 ($616) $4,126 $721 36% Net Margin $0 $0 $0 -6% Other $0 $0 0% EBIT ($616) $721 -6% Interest (Short $0 $0 0% & Long) Taxes & Tariffs ($154) $180 -1% Profit Sharing Net Profit $0 $17 0% ($462) $524 -4% $30
Step by Step Solution
There are 3 Steps involved in it

Get step-by-step solutions from verified subject matter experts