

Question: PLEASE help my with the right answer please A manager wishes to build a control chart for a process. A total of five (05) samples
PLEASE help my with the right answer please
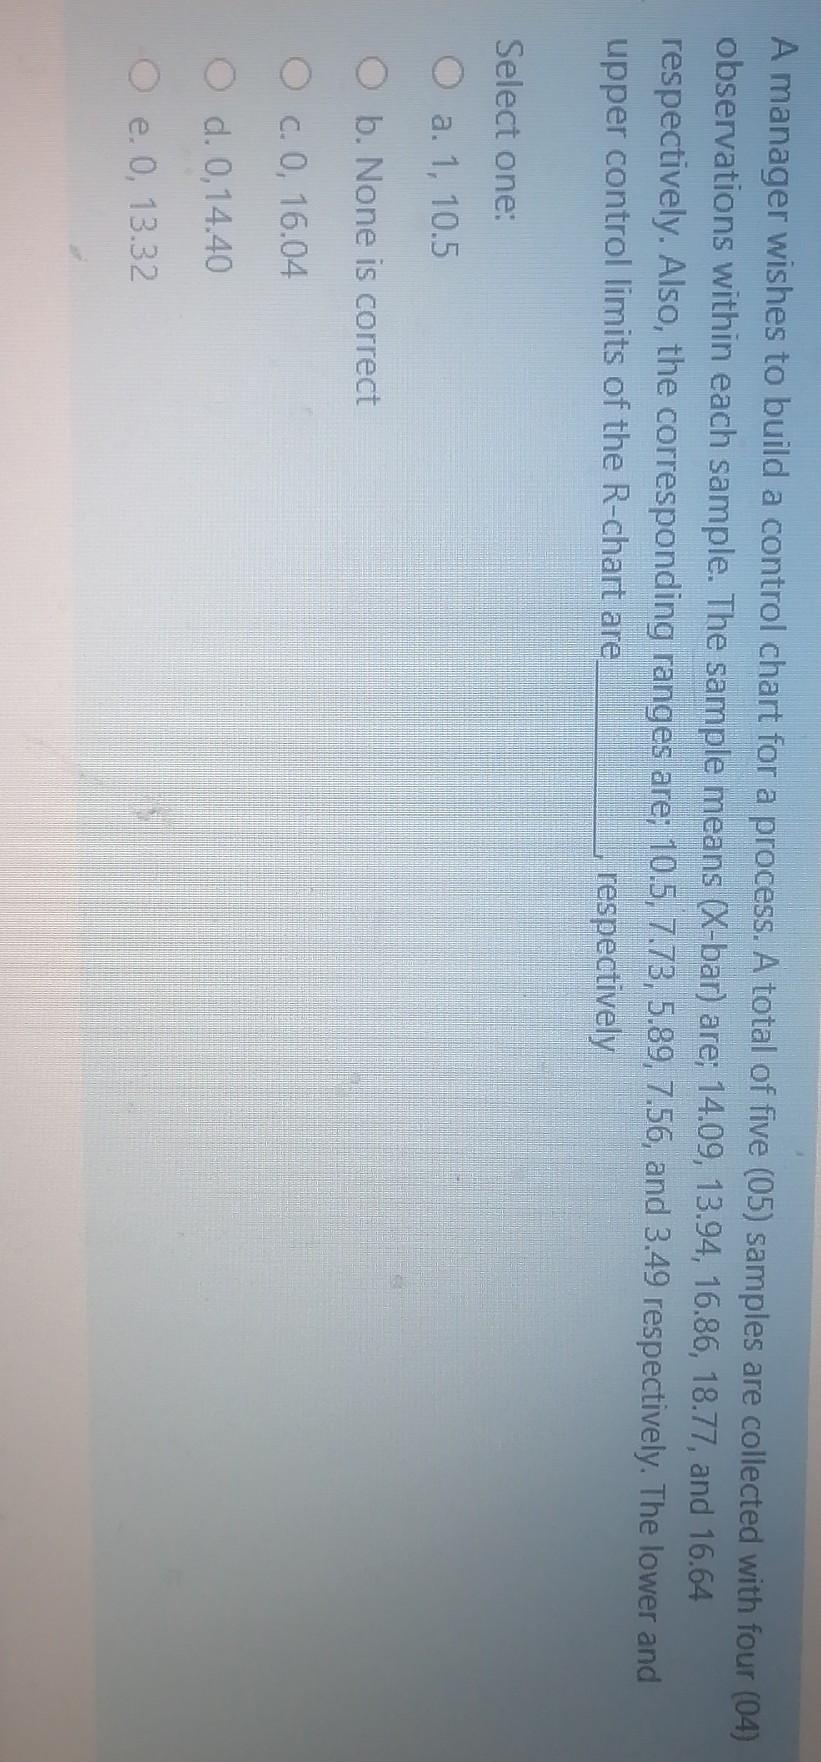
A manager wishes to build a control chart for a process. A total of five (05) samples are collected with four (04) observations within each sample. The sample means (X-bar) are; 14.09, 13.94, 16.86, 18.77, and 16.64 respectively. Also, the corresponding ranges are; 10.5, 7.73, 5.89, 7.56, and 3.49 respectively. The lower and upper control limits of the R-chart are respectively Select one: a. 1, 10.5 O b. None is correct O c. O, 16.04 O d. 0,14.40 O e. 0, 13.32Step by Step Solution
There are 3 Steps involved in it
1 Expert Approved Answer
Step: 1 Unlock

Question Has Been Solved by an Expert!
Get step-by-step solutions from verified subject matter experts
Step: 2 Unlock
Step: 3 Unlock