

Question: PLEASE help need before 3:30pm. Turn in a PDE with vou Oitten answers and an XLS file with a tab per question (clearly labeled). Show
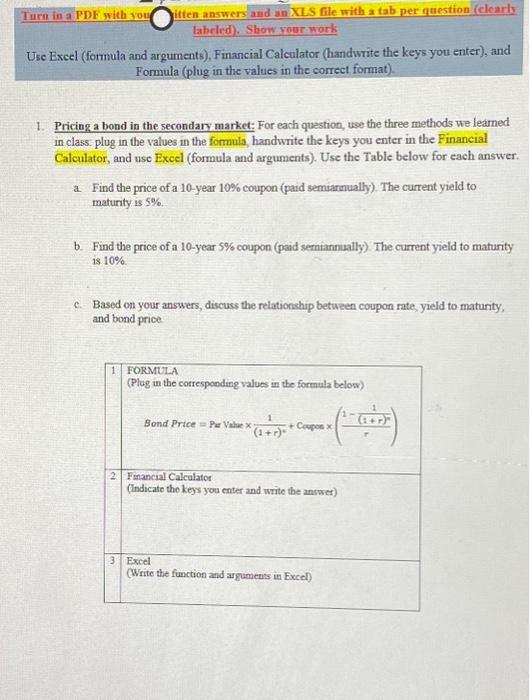
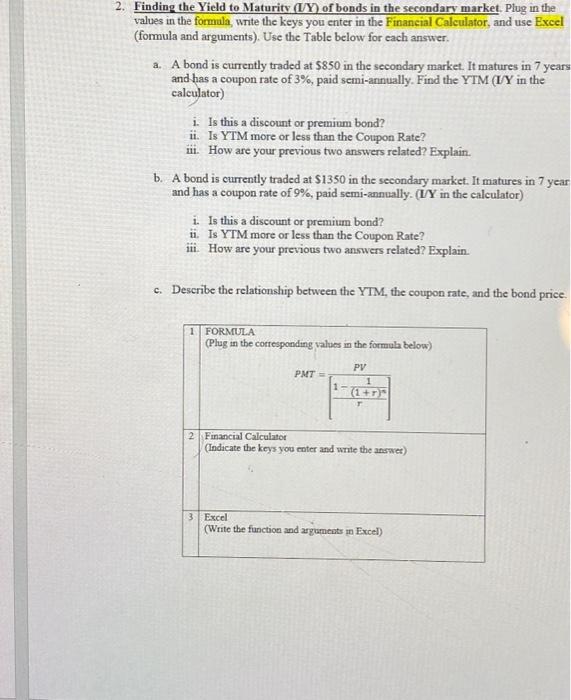
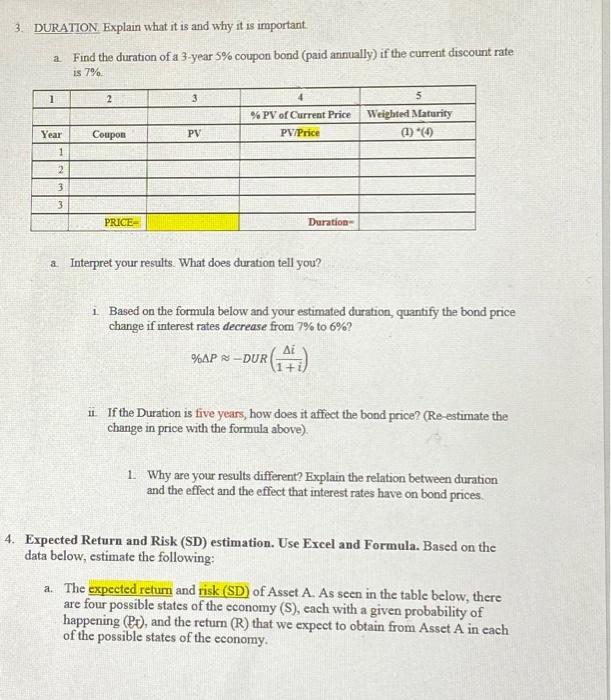
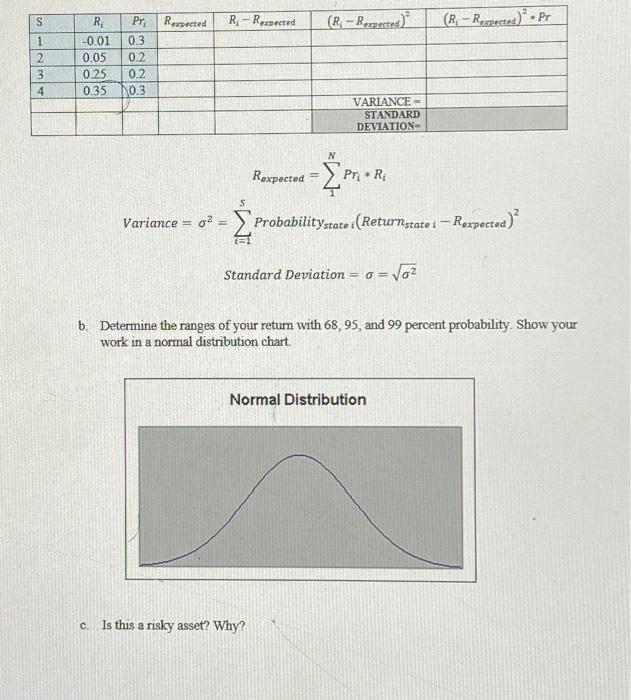
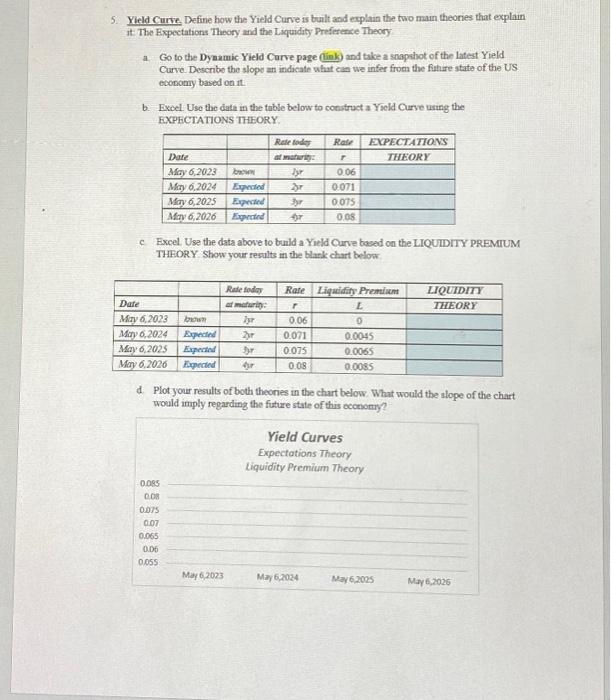
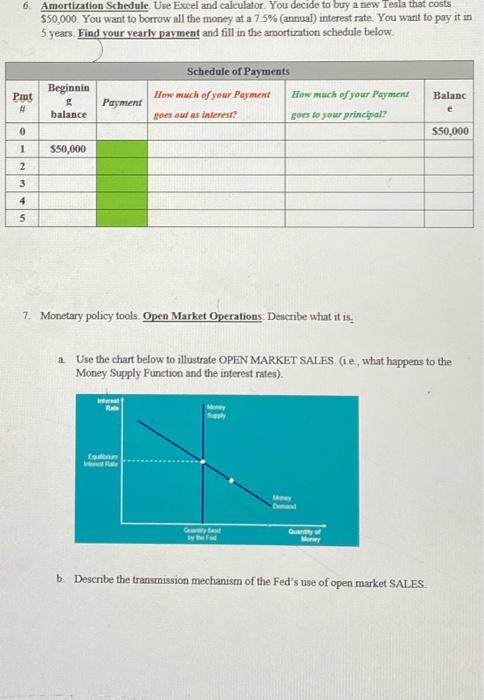
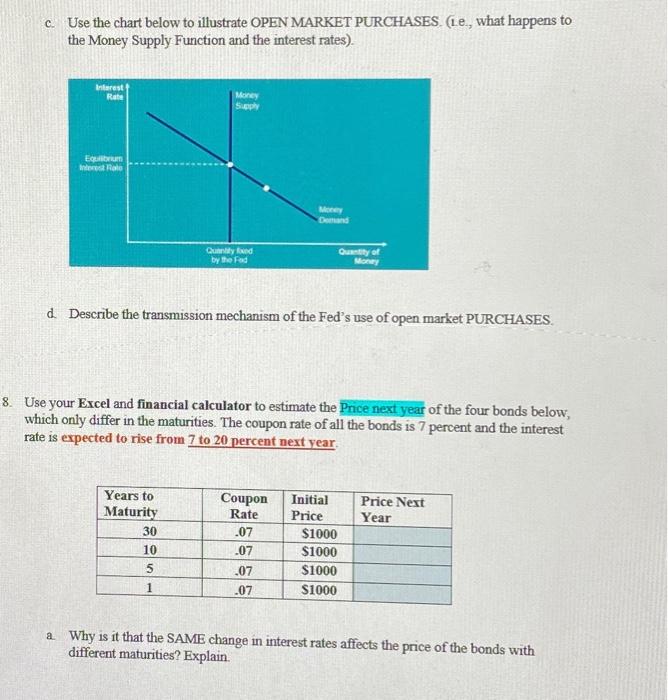
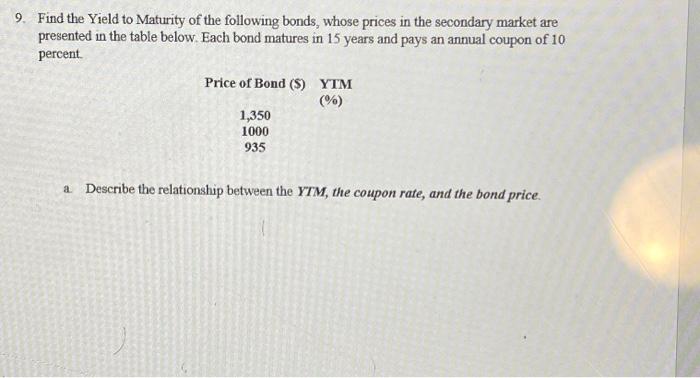
Turn in a PDE with vou Oitten answers and an XLS file with a tab per question (clearly labeled). Show vour wark Use Excel (formula and arquments), Financial Calculator (handwrite the keys you enter), and Formula (plug in the values in the correct format). 1. Pricing a bond in the secondary market: For each question, wse the three methods we leamed in class. plug in the values in the formuls, handwrite the keys you enter in the Financial Calculator, and use Excel (formula and arguments). Use the Table below for each answer. a Find the price of a 10-year 10% coupon (paid semiarnually). The current yield to maturity is 5%. b. Find the price of a 10-year 5% coupon (paid semiannually). The current yield to maturity is 10%. c. Based on your answers, discuss the relationship between coupon rate, yield to maturity, and bond price (formula and arguments), Use the Table below for each answer. a. A bond is currently traded at 5850 in the secondary market. It matures in 7 years and has a coupon rate of 3%, paid semi-annually. Find the YIM (IYY in the calculator) i. Is this a discount or preminm bond? ii. Is YIM more or less than the Coupon Rate? ii. How are your previous two answers related? Explain. b. A bond is currently traded at $1350 in the secondary market. It matures in 7 year and has a coupon rate of 9%, paid semi-annually. (I/Y in the calculator) i. Is this a discount or premitm bond? ii. Is YTM more or less than the Coupon Rate? iii. How are your previous two answers related? Explain. c. Deseribe the relationship between the YTM, the coupon rate, and the bond price. \begin{tabular}{|l|l|} \hline 1 & FORMULA(Pluginthecortespondingvaluesintheformulabelow) \\ \hline 2 & PMT =[r1(1+r)r1]PV \\ \hline \end{tabular} 3. DURATION Explain what it is and why it is important a. Find the duration of a 3-year 5% coupon bond (paid annually) if the current discount rate. is 7% a. Interpret your results. What does duration tell you? 1. Based on the formula below and your estimated duration, quantify the bond price change if interest rates decrease from 7% to 6% ? %PDUR(1+ii) ii. If the Duration is five years, how does it affect the bond price? (Re-estimate the change in price with the formula above) 1. Why are your results different? Explain the relation between duration and the effect and the effect that interest rates have on bond prices. Expected Return and Risk (SD) estimation. Use Excel and Formula. Based on the data below, estimate the following: a. The expected retum and risk (SD) of Asset A. As seen in the table below, there are four possible states of the economy (S), each with a given probability of happening (B), and the return (R) that we expect to obtain from Asset A in each of the possible states of the economy. StandardDeviation==2 b. Determine the ranges of your return with 68,95 , and 99 percent probability. Show your work in a normal distribution chart c. Is this a risky asset? Why? 5. Yield Curve, Define how the Yield Curve is built and ecplain the two mam theories that explain it The Expectations Theory and the Liquidity Preference Theory a. Go to the Dyaumic Yield Carve page (Gink) and take a snapahot of the latest Yield Curve. Describe the slopv an indicate what can we infer from the fiture state of the US. economy based on it. b. Excel Use the date in the table below to construct a Yseld Curve using the EXPECTATIONS THEORY. c. Excel. Use the data above to buld a Yield Curve based on the LIQUIDIT PREMIUM THEORY: Show your results in the blark chart below. d. Plot your results of both theories in the chart below. What would the slope of the chart would imply regarding the future state of this oconomy? 6. Amortization Schedule. Use Excel and calculator. You decide to bury a new Tesla that costs $50,000. You want to borrow all the money at a 7.5% (annual) interest rate. You want to pay it in 5 years. Find your vearly payment and fill in the amortiration schedule below. 7. Monetary policy tools Open Market Operations: Describe what it is. a. Use the chart below to illustrate OPEN MARKET SALES (ie, what happens to the Money Supply Function and the interest rates) b. Describe the transmission mechanism of the Fed's use of open market SALES c. Use the chart below to illustrate OPEN MARKET PURCHASES. (1e., what happens to the Money Supply Function and the interest rates). d. Describe the transmission mechanism of the Fed's use of open market PURCHASES. Use your Excel and financial calculator to estimate the Price next year of the four bonds below, which only differ in the maturities. The coupon rate of all the bonds is 7 percent and the interest rate is expected to rise from 7 to 20 percent next year. a. Why is it that the SAME change in interest rates affects the price of the bonds with different maturities? Explain 9. Find the Yield to Maturity of the following bonds, whose prices in the secondary market are presented in the table below. Each bond matures in 15 years and pays an annual coupon of 10 percent a. Describe the relationship between the YTM, the coupon rate, and the bond price
Step by Step Solution
There are 3 Steps involved in it

Get step-by-step solutions from verified subject matter experts