

Question: Please Help! Need Benefit-Cost Analysis -5-year business Case. All rows and comumns must be clearly labeled and visible. Need Break-Even Point Graph Need short Summary
Please Help!
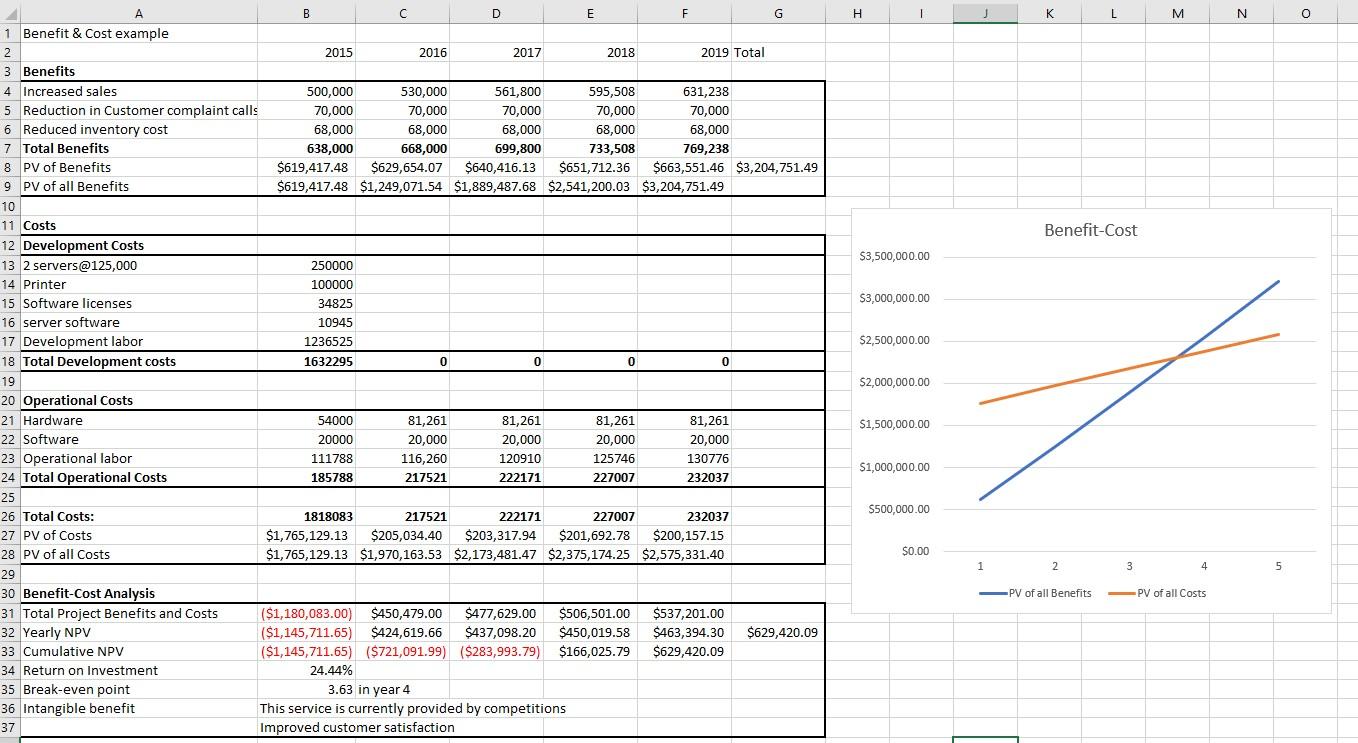
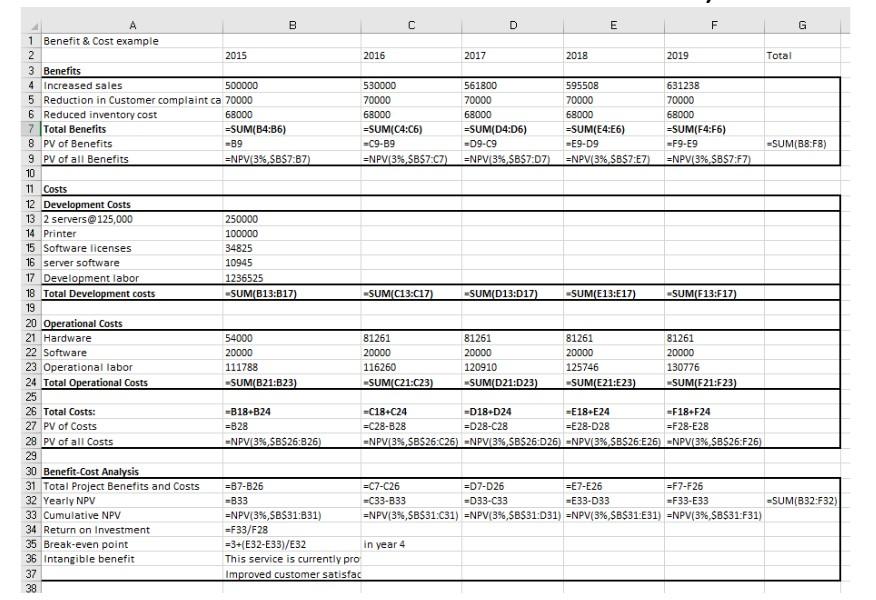
Need Benefit-Cost Analysis -5-year business Case. All rows and comumns must be clearly labeled and visible.
Need Break-Even Point Graph
Need short Summary of the Benefit-Cost Analysis findings and recommendation.
I have provided the sample Benefit-Cost Analysis and brean even point graph too.
Please Help!
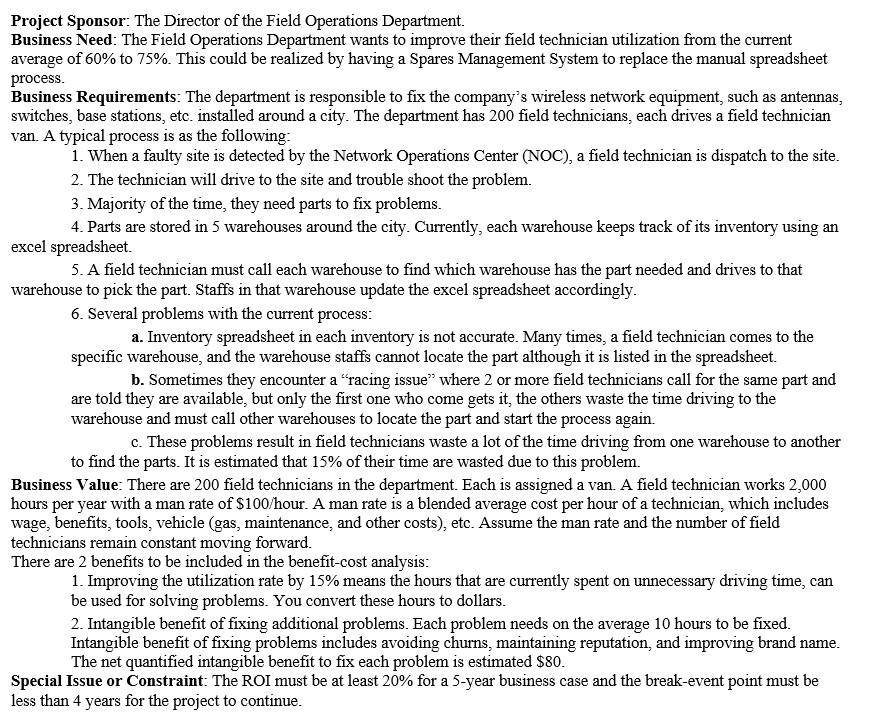
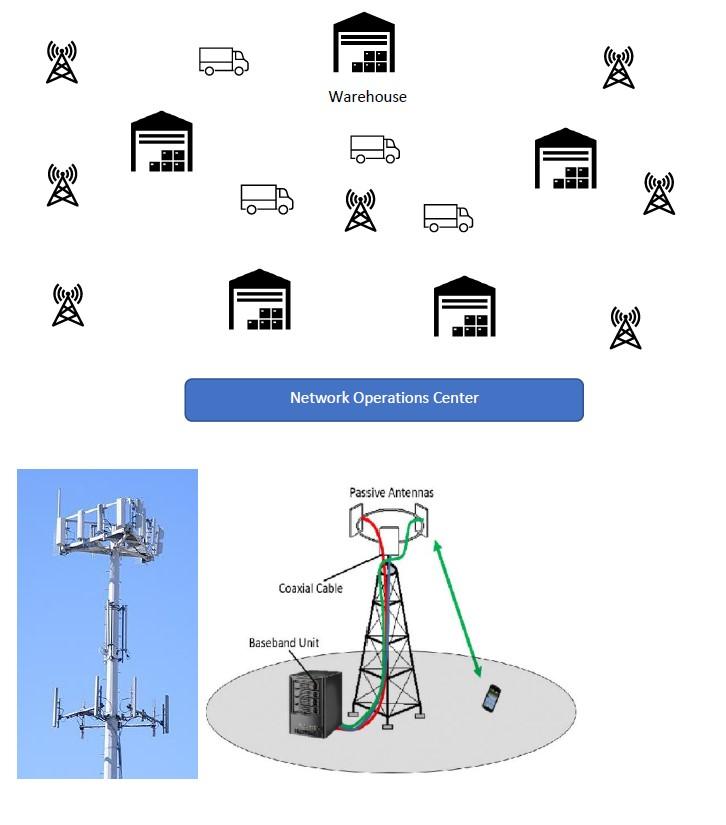
Project Sponsor: The Director of the Field Operations Department. Business Need: The Field Operations Department wants to improve their field technician utilization from the current average of 60% to 75%. This could be realized by having a Spares Management System to replace the manual spreadsheet process. Business Requirements: The department is responsible to fix the company's wireless network equipment, such as antennas, switches, base stations, etc. installed around a city. The department has 200 field technicians, each drives a field technician van. A typical process is as the following: 1. When a faulty site is detected by the Network Operations Center (NOC), a field technician is dispatch to the site. 2. The technician will drive to the site and trouble shoot the problem. 3. Majority of the time, they need parts to fix problems. 4. Parts are stored in 5 warehouses around the city. Currently, each warehouse keeps track of its inventory using an excel spreadsheet 5. A field technician must call each warehouse to find which warehouse has the part needed and drives to that warehouse to pick the part. Staffs in that warehouse update the excel spreadsheet accordingly. 6. Several problems with the current process: a. Inventory spreadsheet in each inventory is not accurate. Many times, a field technician comes to the specific warehouse, and the warehouse staffs cannot locate the part although it is listed in the spreadsheet. b. Sometimes they encounter a racing issue where 2 or more field technicians call for the same part and are told they are available, but only the first one who come gets it, the others waste the time driving to the warehouse and must call other warehouses to locate the part and start the process again. c. These problems result in field technicians waste a lot of the time driving from one warehouse to another to find the parts. It is estimated that 15% of their time are wasted due to this problem. Business Value: There are 200 field technicians in the department. Each is assigned a van. A field technician works 2,000 hours per year with a man rate of $100/hour. A man rate is a blended average cost per hour of a technician, which includes wage, benefits, tools, vehicle (gas, maintenance, and other costs), etc. Assume the man rate and the number of field technicians remain constant moving forward. There are 2 benefits to be included in the benefit-cost analysis: 1. Improving the utilization rate by 15% means the hours that are currently spent on unnecessary driving time, can be used for solving problems. You convert these hours to dollars. 2. Intangible benefit of fixing additional problems. Each problem needs on the average 10 hours to be fixed. Intangible benefit of fixing problems includes avoiding churns, maintaining reputation, and improving brand name. The net quantified intangible benefit to fix each problem is estimated $80. Special Issue or Constraint: The ROI must be at least 20% for a 5-year business case and the break-event point must be less than 4 years for the project to continue. Warehouse Cara con Network Operations Center Passive Antennas Coaxial cable Baseband Unit H 1 J K L M M N O Benefit-Cost $3,500,000.00 $3,000,000.00 $2,500,000.00 B C D E F G 1 Benefit & Cost example 2 2015 2016 2017 2018 2019 Total 3 Benefits 4 Increased sales 500,000 530,000 561,800 595,508 631,238 5 Reduction in Customer complaint calls 70,000 70,000 70,000 70,000 70,000 6 Reduced inventory cost 68,000 68,000 68,000 68,000 68,000 7 Total Benefits 638,000 668,000 699,800 733,508 769,238 8 PV of Benefits $619,417.48 $629,654.07 $640,416.13 $651,712.36 $663,551.46 $3,204,751.49 9 PV of all Benefits $619,417.48 $1,249,071.54 $1,889,487.68 $2,541,200.03 $3,204,751.49 10 11 Costs 12 Development Costs 13 2 servers@125,000 250000 14 Printer 100000 15 Software licenses 34825 16 server software 10945 17 Development labor 1236525 18 Total Development costs 1632295 0 0 0 0 0 19 20 Operational Costs 21 Hardware 54000 81,261 81,261 81,261 81,261 22 Software 20000 20,000 20,000 20,000 20,000 23 Operational labor 111788 116,260 120910 125746 130776 24 Total Operational Costs 185788 217521 222171 227007 232037 25 26 Total Costs: 1818083 217521 222171 227007 232037 27 PV of Costs $1,765,129.13 $205,034.40 $203,317.94 $201,692.78 $200,157.15 28 PV of all Costs $1,765,129.13 $1,970,163.53 $2,173,481.47 $2,375,174.25 $2,575,331.40 29 30 Benefit Cost Analysis 31 Total Project Benefits and Costs ($1,180,083.00) $450,479.00 $477,629.00 $506,501.00 $537,201.00 32 Yearly NPV ($1,145,711.65) $424,619.66 $437,098.20 $450,019.58 $463,394.30 $629,420.09 33 Cumulative NPV ($1,145,711.65) ($721,091.99) ($283,993.79) $166,025.79 $629,420.09 34 Return on Investment 24.44% 35 Break-even point 3.63 in year 4 36 Intangible benefit This service is currently provided by competitions 37 Improved customer satisfaction $2,000,000.00 $1,500,000.00 $1,000,000.00 $500,000.00 $0.00 1 2 3 4 5 5 PV of all Benefits PV of all Costs G A B C D E F 1 Benefit & Cost example 2 2015 2016 2017 2018 2019 Total 3 Benefits 4 Increased sales 500000 530000 561800 595508 631238 5 Reduction in Customer complaint ca 70000 70000 70000 70000 70000 6 Reduced inventory cost 68000 68000 68000 68000 68000 7 Total Benefits =SUM(B4:36) =SUM(C4:06) =SUM(D4:06) =SUM(E4:06) =SUM(F4:F6) 8 PV of Benefits -B9 -C9-B9 -09-09 -E9-09 -F9-E9 -SUM(B8:F8) 9 PV of all Benefits =NPV 3% SBS7:37) ENPV(3%SB57:07) ENPV 3% SB$7:07) =NPV/ 3% SB$7:E7 =NPV[3% SB$7:F7) 10 11 Costs 12 Development Costs 13 2 servers@125,000 250000 14 Printer 100000 15 Software licenses 34825 16 server software 10945 17 Development labor 1236525 18 Total Development costs -SUM(B13:B17) -SUM(C13:017) -SUM D13:017) -SUM(E13:17) -SUM(F13:F17) 19 20 Operational Costs 21 Hardware 54000 81261 81261 81261 81261 22 Software 20000 20000 20000 20000 20000 23 Operational labor 111788 116260 120910 125746 130776 24 Total Operational Costs -SUM(B21:B23) SUM(C21:C23) SUM D21:D23) -SUM(E21:E23) -SUM(F21:F23) 25 26 Total Costs: -B18B24 -C18+C24 -D18 D24 -E18 E24 =F18+F24 27 PV of Costs =B28 =C28-B28 =D28-C28 =E 28-D28 =F28-E28 28 PV of all Costs -NPV 3% SB$26:826 -NPV 39,58526:026) -NPV[3%, SB$26:D26) -NPV/3% $B$26:E26) ENPV[3% $B$26:F26) 29 30 Benefit Cost Analysis 31 Total Project Benefits and Costs =B7-B26 =C7-C26 =D7-D26 =E7-E26 =F7-F26 32 Yearly NPV =B33 =C33-B33 =D33-C33 -E33-033 =F33-E33 -SUM(B32:F32) 33 Cumulative NPV =NPV(3%,SB$31:B31) =NPV/3%,$B$31.C31) =NPV[3%,$B$31:031) ENPV(3%,$B$31:531) =NPV(3%,$B$31:F31) 34 Return on Investment =F33/F28 35 Break-even point =3+(E32-E33)/E32 in year 4 36 Intangible benefit This service is currently pro 37 Improved customer satisfac 38 Project Sponsor: The Director of the Field Operations Department. Business Need: The Field Operations Department wants to improve their field technician utilization from the current average of 60% to 75%. This could be realized by having a Spares Management System to replace the manual spreadsheet process. Business Requirements: The department is responsible to fix the company's wireless network equipment, such as antennas, switches, base stations, etc. installed around a city. The department has 200 field technicians, each drives a field technician van. A typical process is as the following: 1. When a faulty site is detected by the Network Operations Center (NOC), a field technician is dispatch to the site. 2. The technician will drive to the site and trouble shoot the problem. 3. Majority of the time, they need parts to fix problems. 4. Parts are stored in 5 warehouses around the city. Currently, each warehouse keeps track of its inventory using an excel spreadsheet 5. A field technician must call each warehouse to find which warehouse has the part needed and drives to that warehouse to pick the part. Staffs in that warehouse update the excel spreadsheet accordingly. 6. Several problems with the current process: a. Inventory spreadsheet in each inventory is not accurate. Many times, a field technician comes to the specific warehouse, and the warehouse staffs cannot locate the part although it is listed in the spreadsheet. b. Sometimes they encounter a racing issue where 2 or more field technicians call for the same part and are told they are available, but only the first one who come gets it, the others waste the time driving to the warehouse and must call other warehouses to locate the part and start the process again. c. These problems result in field technicians waste a lot of the time driving from one warehouse to another to find the parts. It is estimated that 15% of their time are wasted due to this problem. Business Value: There are 200 field technicians in the department. Each is assigned a van. A field technician works 2,000 hours per year with a man rate of $100/hour. A man rate is a blended average cost per hour of a technician, which includes wage, benefits, tools, vehicle (gas, maintenance, and other costs), etc. Assume the man rate and the number of field technicians remain constant moving forward. There are 2 benefits to be included in the benefit-cost analysis: 1. Improving the utilization rate by 15% means the hours that are currently spent on unnecessary driving time, can be used for solving problems. You convert these hours to dollars. 2. Intangible benefit of fixing additional problems. Each problem needs on the average 10 hours to be fixed. Intangible benefit of fixing problems includes avoiding churns, maintaining reputation, and improving brand name. The net quantified intangible benefit to fix each problem is estimated $80. Special Issue or Constraint: The ROI must be at least 20% for a 5-year business case and the break-event point must be less than 4 years for the project to continue. Warehouse Cara con Network Operations Center Passive Antennas Coaxial cable Baseband Unit H 1 J K L M M N O Benefit-Cost $3,500,000.00 $3,000,000.00 $2,500,000.00 B C D E F G 1 Benefit & Cost example 2 2015 2016 2017 2018 2019 Total 3 Benefits 4 Increased sales 500,000 530,000 561,800 595,508 631,238 5 Reduction in Customer complaint calls 70,000 70,000 70,000 70,000 70,000 6 Reduced inventory cost 68,000 68,000 68,000 68,000 68,000 7 Total Benefits 638,000 668,000 699,800 733,508 769,238 8 PV of Benefits $619,417.48 $629,654.07 $640,416.13 $651,712.36 $663,551.46 $3,204,751.49 9 PV of all Benefits $619,417.48 $1,249,071.54 $1,889,487.68 $2,541,200.03 $3,204,751.49 10 11 Costs 12 Development Costs 13 2 servers@125,000 250000 14 Printer 100000 15 Software licenses 34825 16 server software 10945 17 Development labor 1236525 18 Total Development costs 1632295 0 0 0 0 0 19 20 Operational Costs 21 Hardware 54000 81,261 81,261 81,261 81,261 22 Software 20000 20,000 20,000 20,000 20,000 23 Operational labor 111788 116,260 120910 125746 130776 24 Total Operational Costs 185788 217521 222171 227007 232037 25 26 Total Costs: 1818083 217521 222171 227007 232037 27 PV of Costs $1,765,129.13 $205,034.40 $203,317.94 $201,692.78 $200,157.15 28 PV of all Costs $1,765,129.13 $1,970,163.53 $2,173,481.47 $2,375,174.25 $2,575,331.40 29 30 Benefit Cost Analysis 31 Total Project Benefits and Costs ($1,180,083.00) $450,479.00 $477,629.00 $506,501.00 $537,201.00 32 Yearly NPV ($1,145,711.65) $424,619.66 $437,098.20 $450,019.58 $463,394.30 $629,420.09 33 Cumulative NPV ($1,145,711.65) ($721,091.99) ($283,993.79) $166,025.79 $629,420.09 34 Return on Investment 24.44% 35 Break-even point 3.63 in year 4 36 Intangible benefit This service is currently provided by competitions 37 Improved customer satisfaction $2,000,000.00 $1,500,000.00 $1,000,000.00 $500,000.00 $0.00 1 2 3 4 5 5 PV of all Benefits PV of all Costs G A B C D E F 1 Benefit & Cost example 2 2015 2016 2017 2018 2019 Total 3 Benefits 4 Increased sales 500000 530000 561800 595508 631238 5 Reduction in Customer complaint ca 70000 70000 70000 70000 70000 6 Reduced inventory cost 68000 68000 68000 68000 68000 7 Total Benefits =SUM(B4:36) =SUM(C4:06) =SUM(D4:06) =SUM(E4:06) =SUM(F4:F6) 8 PV of Benefits -B9 -C9-B9 -09-09 -E9-09 -F9-E9 -SUM(B8:F8) 9 PV of all Benefits =NPV 3% SBS7:37) ENPV(3%SB57:07) ENPV 3% SB$7:07) =NPV/ 3% SB$7:E7 =NPV[3% SB$7:F7) 10 11 Costs 12 Development Costs 13 2 servers@125,000 250000 14 Printer 100000 15 Software licenses 34825 16 server software 10945 17 Development labor 1236525 18 Total Development costs -SUM(B13:B17) -SUM(C13:017) -SUM D13:017) -SUM(E13:17) -SUM(F13:F17) 19 20 Operational Costs 21 Hardware 54000 81261 81261 81261 81261 22 Software 20000 20000 20000 20000 20000 23 Operational labor 111788 116260 120910 125746 130776 24 Total Operational Costs -SUM(B21:B23) SUM(C21:C23) SUM D21:D23) -SUM(E21:E23) -SUM(F21:F23) 25 26 Total Costs: -B18B24 -C18+C24 -D18 D24 -E18 E24 =F18+F24 27 PV of Costs =B28 =C28-B28 =D28-C28 =E 28-D28 =F28-E28 28 PV of all Costs -NPV 3% SB$26:826 -NPV 39,58526:026) -NPV[3%, SB$26:D26) -NPV/3% $B$26:E26) ENPV[3% $B$26:F26) 29 30 Benefit Cost Analysis 31 Total Project Benefits and Costs =B7-B26 =C7-C26 =D7-D26 =E7-E26 =F7-F26 32 Yearly NPV =B33 =C33-B33 =D33-C33 -E33-033 =F33-E33 -SUM(B32:F32) 33 Cumulative NPV =NPV(3%,SB$31:B31) =NPV/3%,$B$31.C31) =NPV[3%,$B$31:031) ENPV(3%,$B$31:531) =NPV(3%,$B$31:F31) 34 Return on Investment =F33/F28 35 Break-even point =3+(E32-E33)/E32 in year 4 36 Intangible benefit This service is currently pro 37 Improved customer satisfac 38
Step by Step Solution
There are 3 Steps involved in it

Get step-by-step solutions from verified subject matter experts