

Question: please help need by tommorow! To Do Assignment Details statistics 101 Conduct an analysis of variance (ANOVA) to check for mean differences between three independent
please help need by tommorow! 
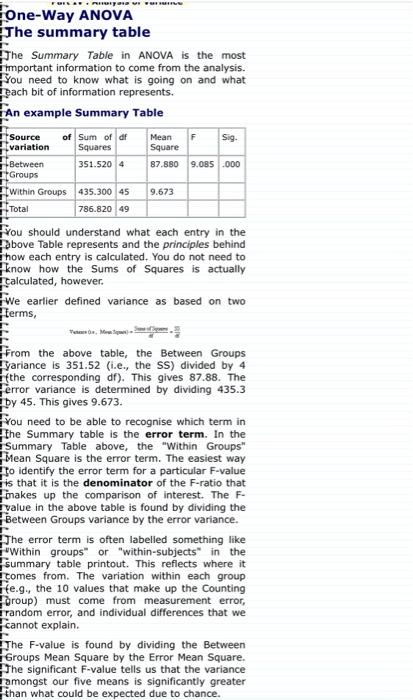
To Do Assignment Details statistics 101 Conduct an analysis of variance (ANOVA) to check for mean differences between three independent groups on any variable of your choice (i.e., Is there a difference in coffee consumption per week between those under age 18, those between 18-25, and those above age 25?). Each sample should have a minimum of n = 6 participants. What to turn in: 1. State your research question (use the example from above as a model). 2. State the null and alternative hypotheses for your ANOVA. 3. Using a = .05 for your test, indicate the critical F-value, conduct the necessary calculations (show your work whenever possible) and state your conclusions regarding the original hypotheses (Reject Ho or Fail to Reject Ho). 4. Calculate and interpret n2 as a measure of effect size. 5. Using Tukey's post-hoc test, check for specific significant differences between groups Note: Please do this even if your conclusion above is "Fail to Reject Ho" 6. Write a conclusion statement, as would appear in a published report. Extra Credit (Up to 5 points): 1. Present your findings using an "ANOVA summary table" as discussed on p. 361 of the textbook. This page here also describes this table. BLA. POTOV F One-Way ANOVA The summary table The Summary Table in ANOVA is the most Important information to come from the analysis. You need to know what is going on and what pach bit of information represents. An example Summary Table Source of Sum of df Mean sig. variation Squares Square Between 351.520 4 87.880 9.085.000 within Groups 435,300 45 9.673 Total 786.820 49 You should understand what each entry in the above Table represents and the principles behind how each entry is calculated. You do not need to know how the Sums of Squares is actually calculated, however. we earlier defined variance as based on two terms, Groups From the above table, the Between Groups yariance is 351.52 (i.e., the SS) divided by 4 fthe corresponding an). This gives 87.88. The error variance is determined by dividing 435.3 by 45. This gives 9.673. You need to be able to recognise which term in the Summary table is the error term. In the Summary Table above, the "Within Groups" Mean Square is the error term. The easiest way to identify the error term for a particular F-value is that it is the denominator of the F-ratio that makes up the comparison of interest. The F- value in the above table is found by dividing the Between Groups variance by the error variance. The error term is often labelled something like Within groups" or "within-subjects in the summary table printout. This reflects where it tomes from. The variation within each group He..., the 10 values that make up the counting oroup) must come from measurement error, random error, and individual differences that we cannot explain. The F-value is found by dividing the Between Groups Mean Square by the Error Mean Square. The significant F-value tells us that the variance amongst our five means is significantly greater than what could be expected due to chance Step by Step Solution
There are 3 Steps involved in it
1 Expert Approved Answer
Step: 1 Unlock

Question Has Been Solved by an Expert!
Get step-by-step solutions from verified subject matter experts
Step: 2 Unlock
Step: 3 Unlock