

Question: Please help!! Need help calculating the ratios that make up the DuPont Identity and calculating the Return On Equity Nederland Consumer Products Company Income Statement
Please help!! Need help calculating the ratios that make up the DuPont Identity and calculating the Return On Equity
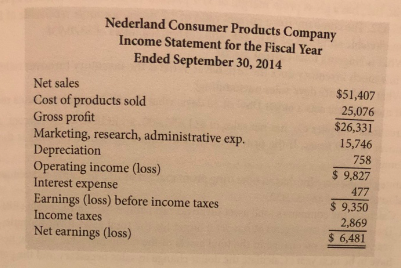
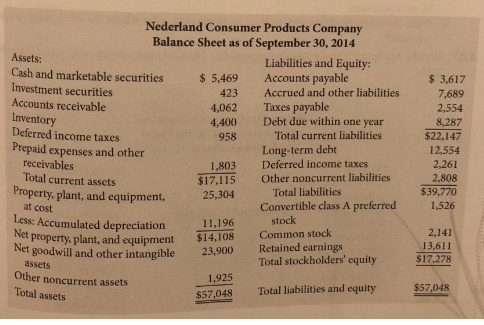
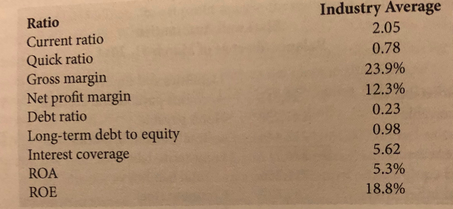
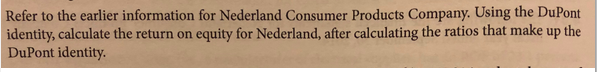
Nederland Consumer Products Company Income Statement for the Fiscal Year Ended September 30, 2014 Net sales Cost of products sold Gross profit Marketing, research, administrative exp. Depreciatiorn Operating income (loss) Interest expense Earnings (loss) before income taxes Income taxes Net earnings (loss) $51,407 25,076 $26,331 15,746 758 $9,827 477 9,350 2,869 6,481 Nederland Consumer Products Company Balance Sheet as of September 30, 2014 Assets: Cash and marketable securities Investment securities Accounts receivable Inventory Deferred income taxes Prepaid expenses and other Liabilities and Equity: Accounts 5,469 423 4,062 4,400 Accrued and other liabilities Taxes payable Debt due within one year 3,617 7,689 2,554 8,287 Total current liabilities Long-term debt $22,147 12,554 2,261 2,808 958 receivables Total current assets 1,803 Deferred income $17,115 Other noncurrent liabilitics Property, plant, and equipment, Total liabilities Convertible class A preferred 25,304 $39,770 at cost 1,526 Less: Accumulated depreciation Net stock Common stock Retained earnings 11,196 $14,108 23,900 1,925 $57,048 property, plant, and equipment et 2,141 goodwill and other intangible 13,611 $17,278 assets Total stockholders' equity Other noncurrent assets Total assets $57,048 Total liabilities and equity Ratio Current ratio Quick ratio Gross margin Net profit margin Debt ratio Long-term debt to equity Interest coverage ROA ROE Industry Average 2.05 0.78 23.9% 12.3% 0.23 0.98 5.62 53% 18.8% Refer to the earlier information for Nederland Consumer Products Company. Using the DuPornt identity, calculate the return on equity for Nederland, after calculating the ratios that make up the DuPont identity
Step by Step Solution
There are 3 Steps involved in it

Get step-by-step solutions from verified subject matter experts