

Question: Please help Observed 31 39 37 34 37 42 Expected 22 29 34 30 28 36 Send data to Excel Test the hypothesis that the
Please help
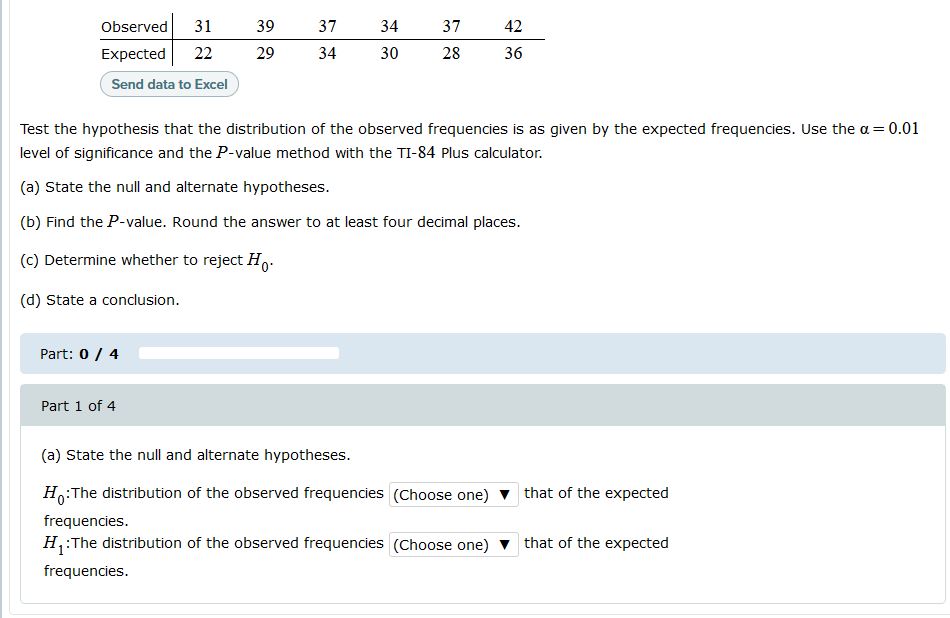
Observed 31 39 37 34 37 42 Expected 22 29 34 30 28 36 Send data to Excel Test the hypothesis that the distribution of the observed frequencies is as given by the expected frequencies. Use the a = 0.01 level of significance and the P-value method with the TI-84 Plus calculator. (a) State the null and alternate hypotheses. (b) Find the P-value. Round the answer to at least four decimal places. (c) Determine whether to reject Ho. (d) State a conclusion. Part: 0 / 4 Part 1 of 4 (a) State the null and alternate hypotheses. H : The distribution of the observed frequencies (Choose one) v that of the expected frequencies. H, : The distribution of the observed frequencies (Choose one) v that of the expected frequencies
Step by Step Solution
There are 3 Steps involved in it

Get step-by-step solutions from verified subject matter experts