

Question: Please help on Problem 2. Codes needed, many thanks! Note: t is a 25*1 (row: 25 col:1) matrix, with entries 1, 2, 3, ... ,
Please help on Problem 2. Codes needed, many thanks!
Note: t is a 25*1 (row: 25 col:1) matrix, with entries 1, 2, 3, ... , 24, 25.
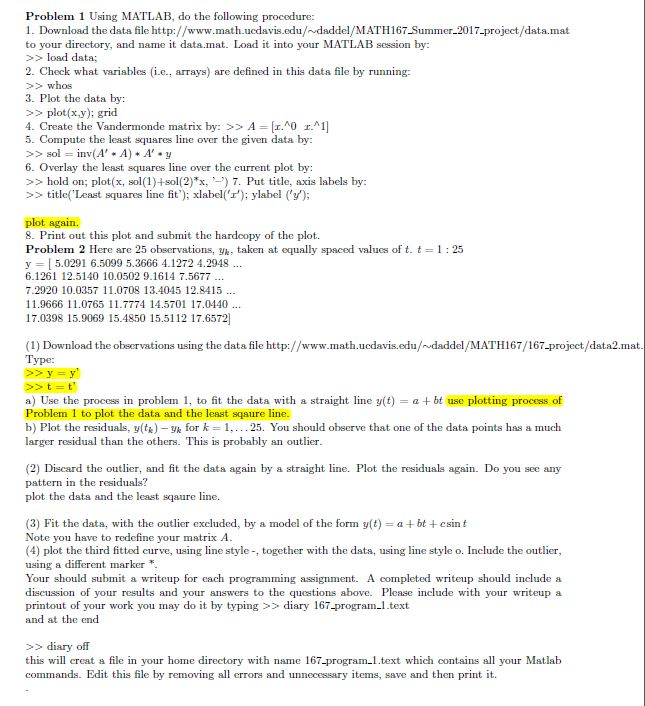
Problem 1 Using MATLAB, do the following procedure: 1. Download the data file http://www.math.ucdavis.edu/daddel/MATH167Summer 2017-project/data.mat to your directory, and name it data.mat. Load it into your MATLAB session by: load data; 2. Check what varisbles i.e., arrays) are defined in this dats file by running whos 3. Plot the data by: >>plot(xy); grid 4. Create the Vandermonde matrix by: > > A [r.?0 r. ] 5. Compute the least squares line over the given data by: >> sol-inv(A, * A) * A, * y 6. Overlay the least squares line over the current plot by: >> hold on; plot(x, so(1)+sol(2)x, 7. Put title, axis labels by: >>title('Least squares line fit); xlabel() ylal ) plot again. 8. Print out this plot and submit the hardcopy of the plot. Problem 2 Here are 25 observations, yk taken at equally spaced values of t. t 1:25 y5.0291 6.5099 5.3666 4.1272 4.2948 6.1261 12.5140 10.0502 9.1614 7.5677. 7.2920 10.0357 11.0708 13.4045 12.8415... 11.9666 11.0765 11.7774 14.5701 17.0440 17.0398 15.9069 15.4850 15.5112 17.6572 (1) Download the observations using the data file http://www.math.ucdavis.edu/daddel/MATH167/167-project/data2.mat Type a) Use the process in problem 1, to fit the data with a straight line y(t) = a + bt use plotting process of Problem 1 to plot the data and the least sqaure line. b) Plot the residuals, y(th)-yk for k 1,.. . 25. You should observe that one of the data points has a much larger residual than the others. This is probably an outlier (2) Discard the outlier, and fit the data again by a straight line. Plot the residusls again. Do you see any pattern in the residusls? plot the data and the least sqaure li ne (3) Fit the data, with the outlier excluded, by a model of the form y(t)-a +bt + esin t ote you have to redefine your matrix A (4) plot the third fitted curve, using line style-, together with the dats, usin line style o. Include the outlier using a different marker Your should submit a writeup for each programming assignment. A completed writeup should include a discussion of your results and your answers to the questions above. Please include with your writeup a printout of your work you may do it by typing > diary 167-program1.text and at the end >>diary off this will creat a file in your home directory with name 167-program1.text which contains all your Matlab commands. Edit this file by removing all errors and unnecessary items, save and then print it
Step by Step Solution
There are 3 Steps involved in it

Get step-by-step solutions from verified subject matter experts