

Question: please help On the following graph, plot Felix's demand for pizza slices using the green points (triangle symbol). Next, plot Janet's demand for pizza slices
please help
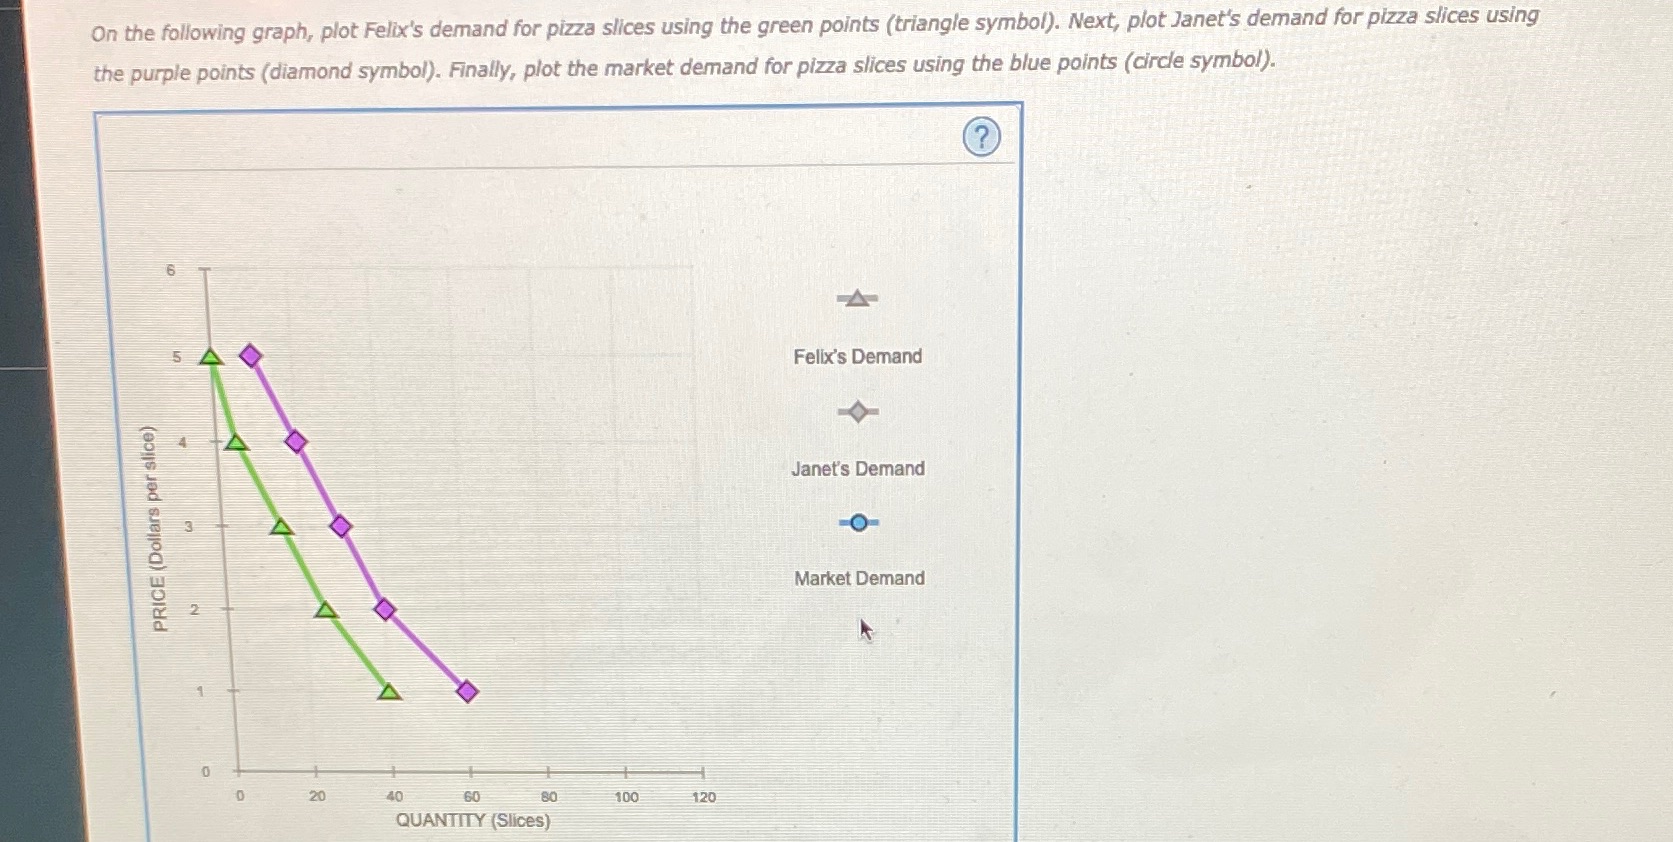
On the following graph, plot Felix's demand for pizza slices using the green points (triangle symbol). Next, plot Janet's demand for pizza slices using the purple points (diamond symbol). Finally, plot the market demand for pizza slices using the blue points (circle symbol). A 5 Felix's Demand PRICE (Dollars per slice) Janet's Demand 3 O- Market Demand 2 20 40 60 80 100 120 QUANTITY (Slices)
Step by Step Solution
There are 3 Steps involved in it
1 Expert Approved Answer
Step: 1 Unlock

Question Has Been Solved by an Expert!
Get step-by-step solutions from verified subject matter experts
Step: 2 Unlock
Step: 3 Unlock