

Question: Please help On the graph, illustrate the change that will occur in the long run. Suppose an economy is in long-run equilibrium. The central bank
Please help
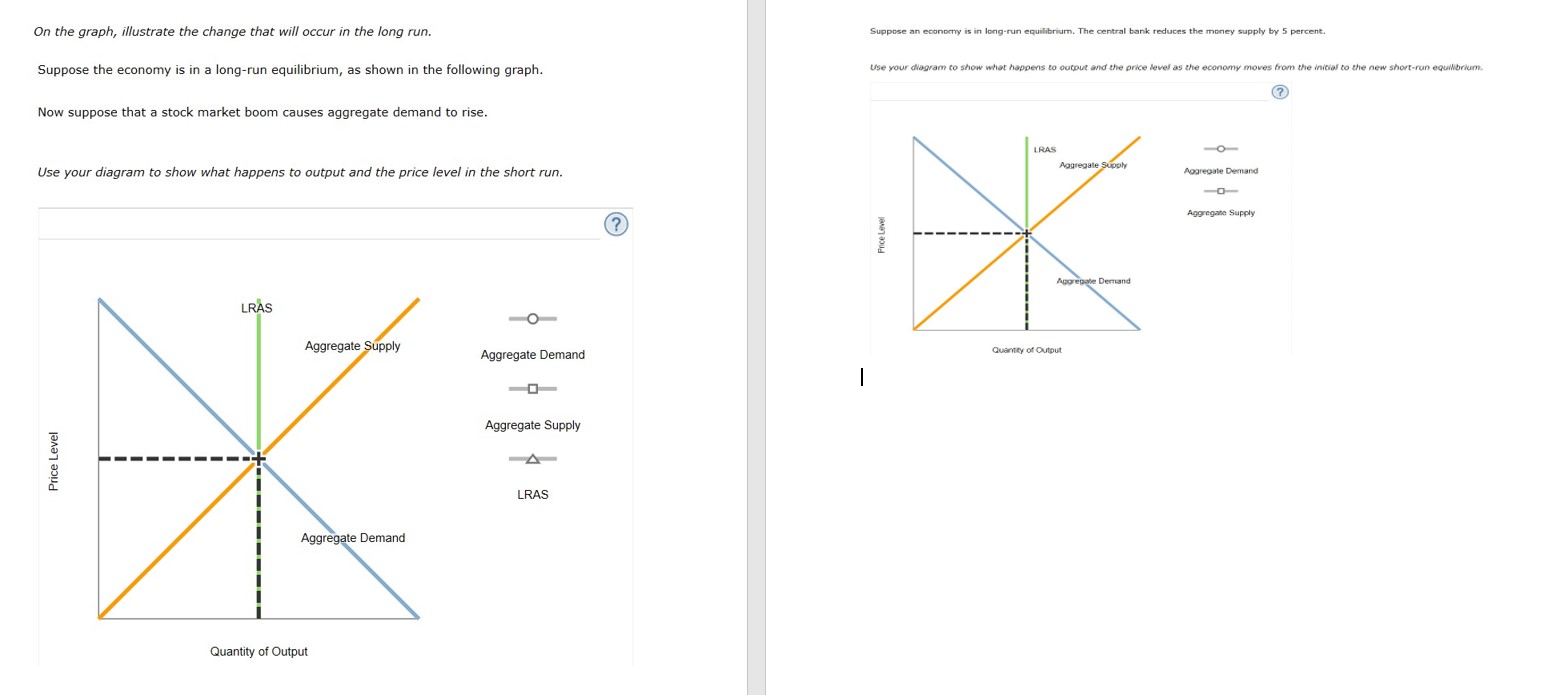
On the graph, illustrate the change that will occur in the long run. Suppose an economy is in long-run equilibrium. The central bank reduces the money supply by 5 percent. Suppose the economy is in a long-run equilibrium, as shown in the following graph. Use your diagram to show what happens to output and the price level as the economy moves from the initial to the new short-run equilibrium. (? Now suppose that a stock market boom causes aggregate demand to rise. IRAS Use your diagram to show what happens to output and the price level in the short run. Aggregate Supply Aggregate Demand -0- (? Price Level Aggregate Supply grepute Demand LRAS O Aggregate Supply Aggregate Demand Quantity of Output - Price Level Aggregate Supply A LRAS Aggregate Demand Quantity of Output
Step by Step Solution
There are 3 Steps involved in it

Get step-by-step solutions from verified subject matter experts