

Question: please help on this question thank you 1. (1 point each) The graph below shows how the vapor pressures of various liquids (a-e) change with
please help on this question thank you 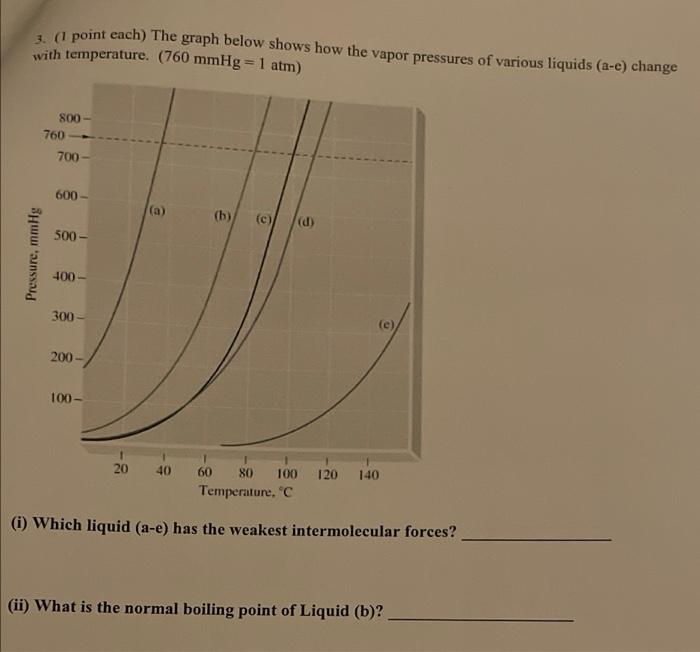
1. (1 point each) The graph below shows how the vapor pressures of various liquids (a-e) change with temperature. (760 mmHg = 1 atm) 800- 760 700 600 - (a) (b) (c) (d) 500 - Pressure, mmHg 400 300 (e) 200 100- 20 40 120 140 60 80 100 Temperature, (i) Which liquid (a-e) has the weakest intermolecular forces? (ii) What is the normal boiling point of Liquid (b)
Step by Step Solution
There are 3 Steps involved in it
1 Expert Approved Answer
Step: 1 Unlock

Question Has Been Solved by an Expert!
Get step-by-step solutions from verified subject matter experts
Step: 2 Unlock
Step: 3 Unlock