

Question: Please help out The table shows the production function of Jackie's Canoe Rides. The rm pays $100 a day for each canoe Cost (dollars per
Please help out
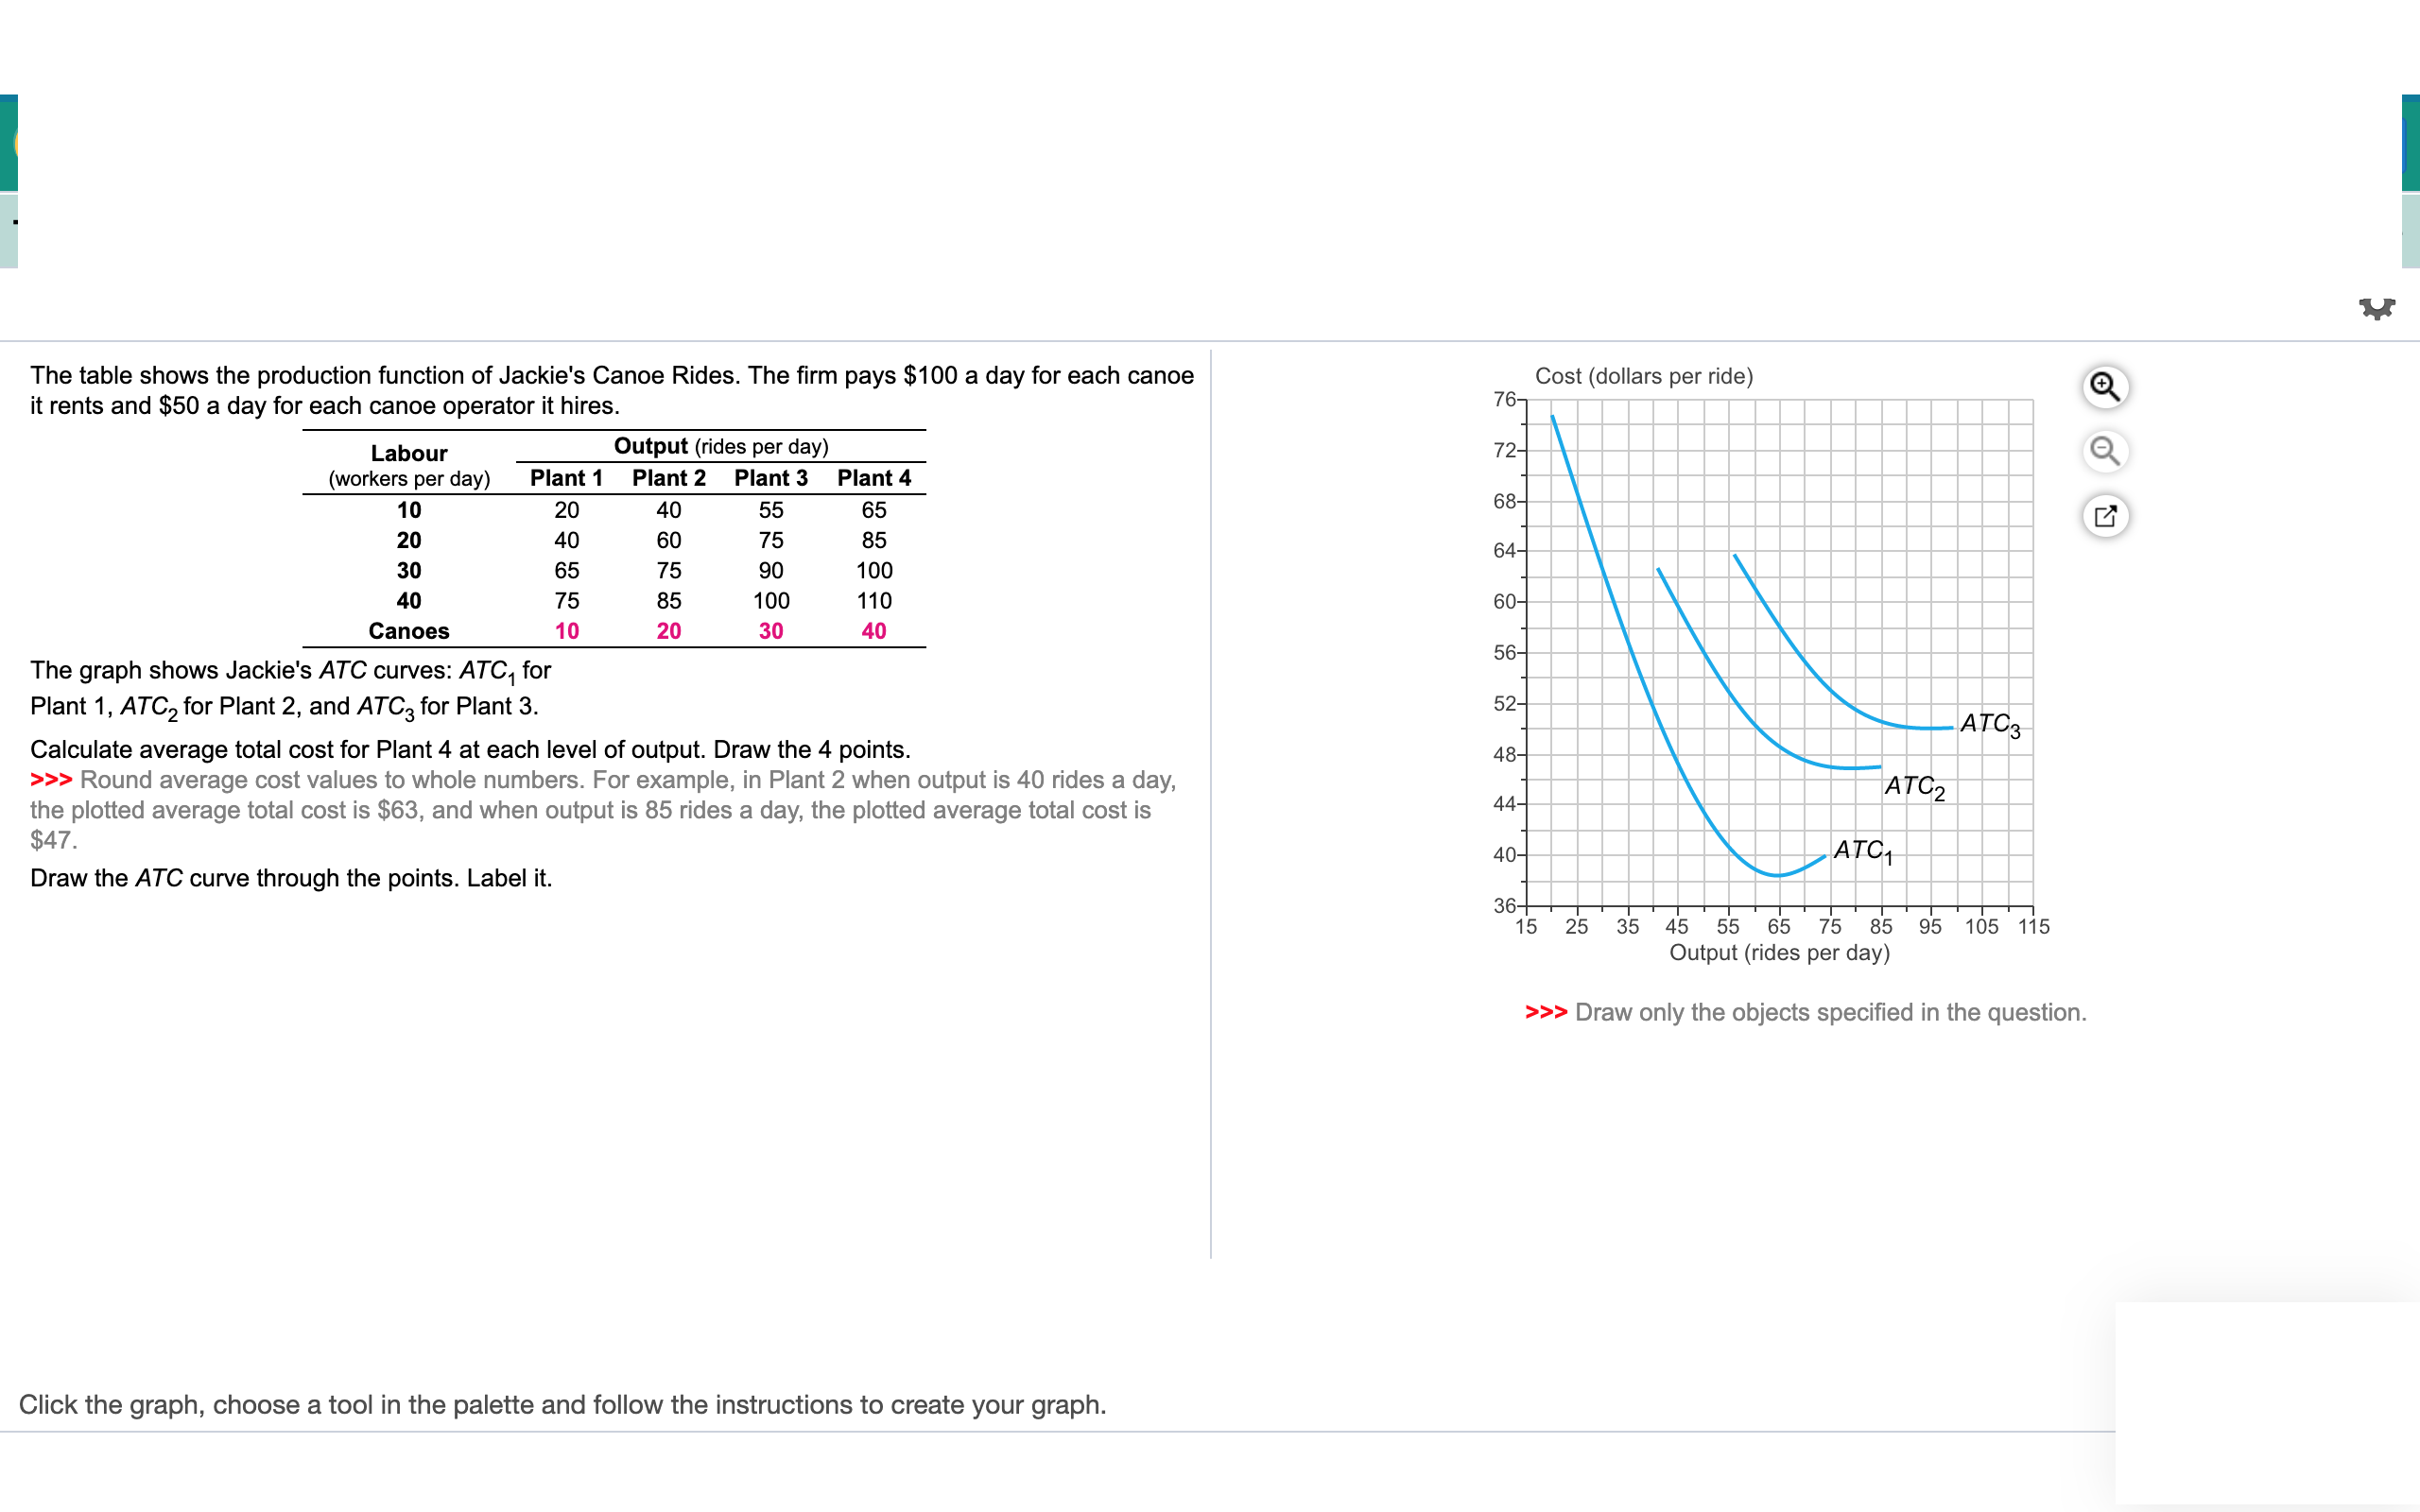
The table shows the production function of Jackie's Canoe Rides. The rm pays $100 a day for each canoe Cost (dollars per ride) i't rents and $50 a day for each canoe operator it hires. 76 Labour Output (rides per day) 72. (workers per day) Plant 1 Plant 2 Plant 3 Plant 4 1o 20 4o 55 65 68 20 40 60 75 85 64 30 65 75 90 100 40 75 85 1 00 1 10 60 Canoes 1 0 20 30 40 56 The graph shows Jackie's ATC curves: ATC1 for Plant 1, ATCZ for Plant 2, and AT03 for Plant 3. 52- 2 Calculate average total cost for Plant 4 at each level of output. Draw the 4 points. 48 > Round average cost values to whole numbers. For example, in Plant 2 when output is 40 rides a day, m2 the plotted average total cost is $63, and when output is 85 rides a day, the plotted average total cost is 44 $47. 40_ A101 Draw the ATC curve through the points. Label it. 361....,....r,. 15 25 35 45 55 65 75 35 95 105115 Output (rides per day) >>> Draw only the objects specied in the question. Click the graph, choose a tool in the palette and follow the instructions to create your graph
Step by Step Solution
There are 3 Steps involved in it

Get step-by-step solutions from verified subject matter experts