

Question: Please help out with 1-6 Homework 3 _ Use the data in homework 2 and build models using normal distribution function and binomial distribution function
Please help out with 1-6
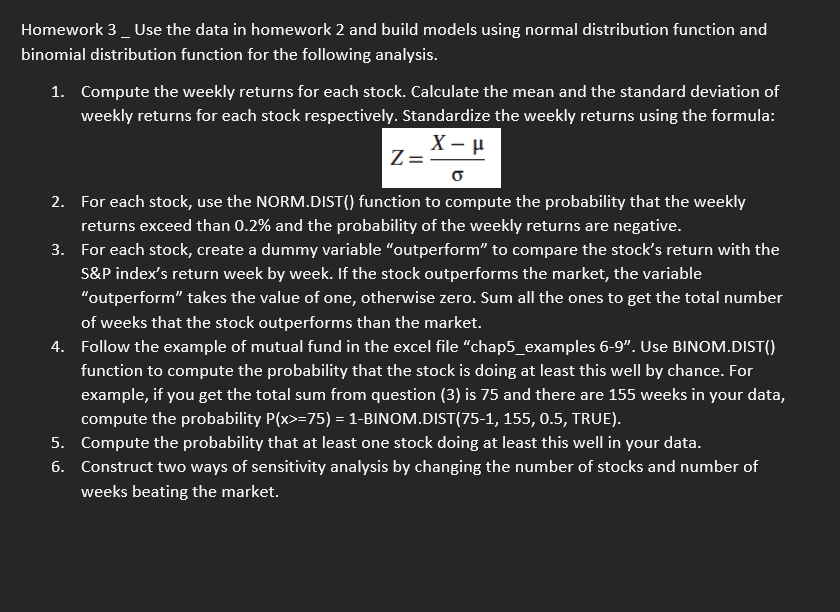
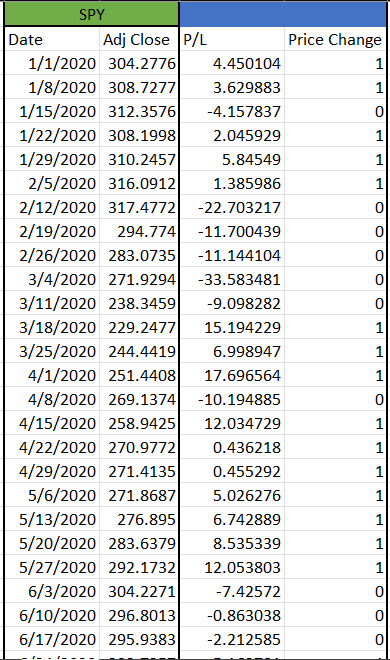
Homework 3 _ Use the data in homework 2 and build models using normal distribution function and binomial distribution function for the following analysis. 1. Compute the weekly returns for each stock. Calculate the mean and the standard deviation of weekly returns for each stock respectively. Standardize the weekly returns using the formula: Z=X 2. For each stock, use the NORM.DIST() function to compute the probability that the weekly returns exceed than 0.2% and the probability of the weekly returns are negative. 3. For each stock, create a dummy variable "outperform" to compare the stock's return with the S\&P index's return week by week. If the stock outperforms the market, the variable "outperform" takes the value of one, otherwise zero. Sum all the ones to get the total number of weeks that the stock outperforms than the market. 4. Follow the example of mutual fund in the excel file "chap5_examples 6-9". Use BINOM.DIST() function to compute the probability that the stock is doing at least this well by chance. For example, if you get the total sum from question (3) is 75 and there are 155 weeks in your data, compute the probability P(x>=75)=1-BINOM.DIST(75-1, 155, 0.5, TRUE). 5. Compute the probability that at least one stock doing at least this well in your data. 6. Construct two ways of sensitivity analysis by changing the number of stocks and number of weeks beating the market. \begin{tabular}{|c|c|c|c|} \hline \multicolumn{2}{|c|}{ SPY } & \multirow[b]{2}{*}{P/L} & \multirow[b]{2}{*}{ Price Change } \\ \hline Date & Adj Close & & \\ \hline 1/1/2020 & 304.2776 & 4.450104 & 1 \\ \hline 1/8/2020 & 308.7277 & 3.629883 & 1 \\ \hline 1/15/2020 & 312.3576 & -4.157837 & 0 \\ \hline 1/22/2020 & 308.1998 & 2.045929 & 1 \\ \hline 1/29/2020 & 310.2457 & 5.84549 & 1 \\ \hline 2/5/2020 & 316.0912 & 1.385986 & 1 \\ \hline 2/12/2020 & 317.4772 & -22.703217 & 0 \\ \hline 2/19/2020 & 294.774 & -11.700439 & 0 \\ \hline 2/26/2020 & 283.0735 & -11.144104 & 0 \\ \hline 3/4/2020 & 271.9294 & -33.583481 & 0 \\ \hline 3/11/2020 & 238.3459 & -9.098282 & 0 \\ \hline 3/18/2020 & 229.2477 & 15.194229 & 1 \\ \hline 3/25/2020 & 244.4419 & 6.998947 & 1 \\ \hline 4/1/2020 & 251.4408 & 17.696564 & 1 \\ \hline 4/8/2020 & 269.1374 & -10.194885 & 0 \\ \hline 4/15/2020 & 258.9425 & 12.034729 & 1 \\ \hline 4/22/2020 & 270.9772 & 0.436218 & 1 \\ \hline 4/29/2020 & 271.4135 & 0.455292 & 1 \\ \hline 5/6/2020 & 271.8687 & 5.026276 & 1 \\ \hline 5/13/2020 & 276.895 & 6.742889 & 1 \\ \hline 5/20/2020 & 283.6379 & 8.535339 & 1 \\ \hline 5/27/2020 & 292.1732 & 12.053803 & 1 \\ \hline 6/3/2020 & 304.2271 & -7.42572 & 0 \\ \hline 6/10/2020 & 296.8013 & -0.863038 & 0 \\ \hline 6/17/2020 & 295.9383 & -2.212585 & 0 \\ \hline \end{tabular}
Step by Step Solution
There are 3 Steps involved in it

Get step-by-step solutions from verified subject matter experts