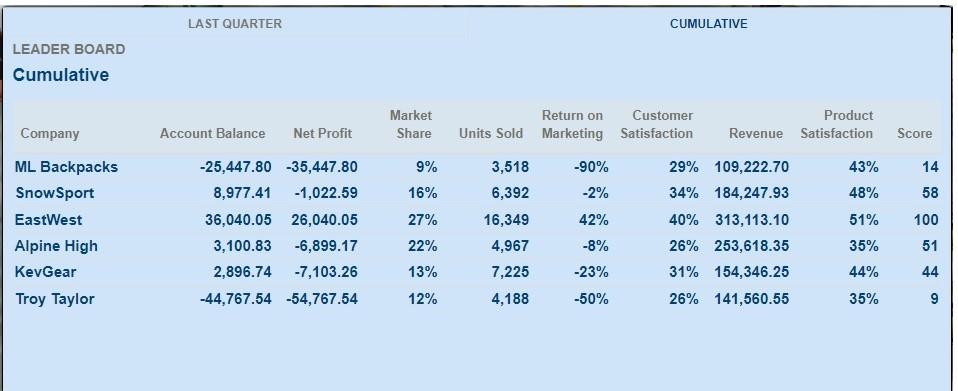
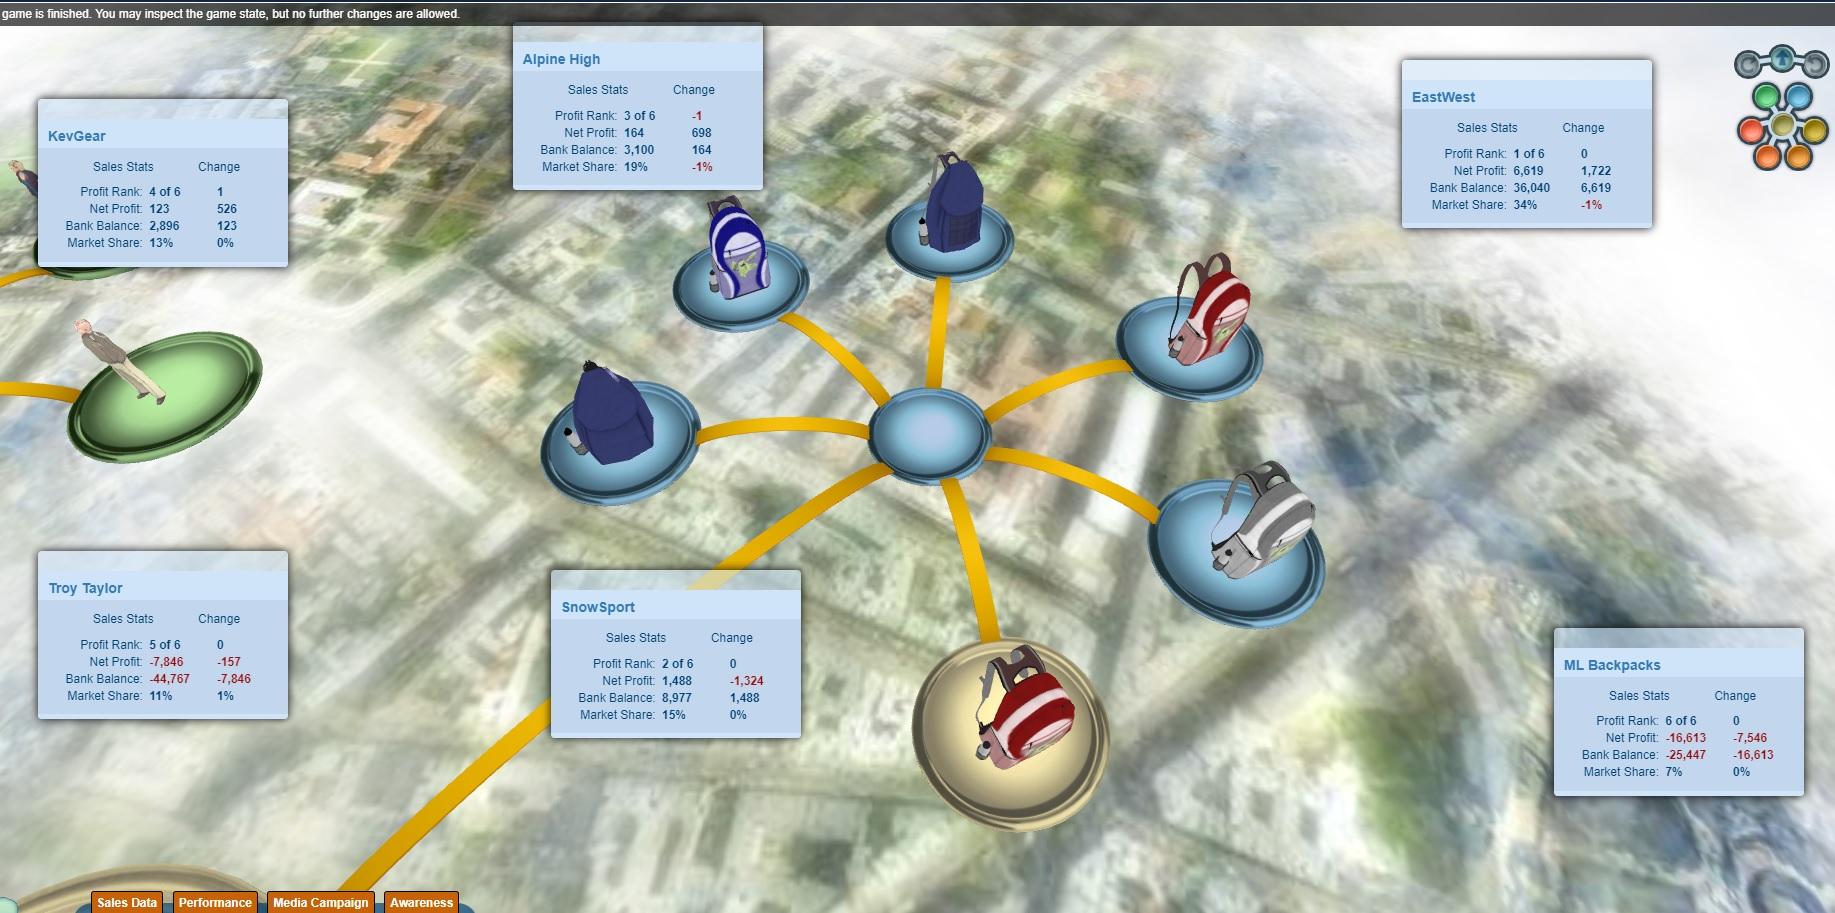
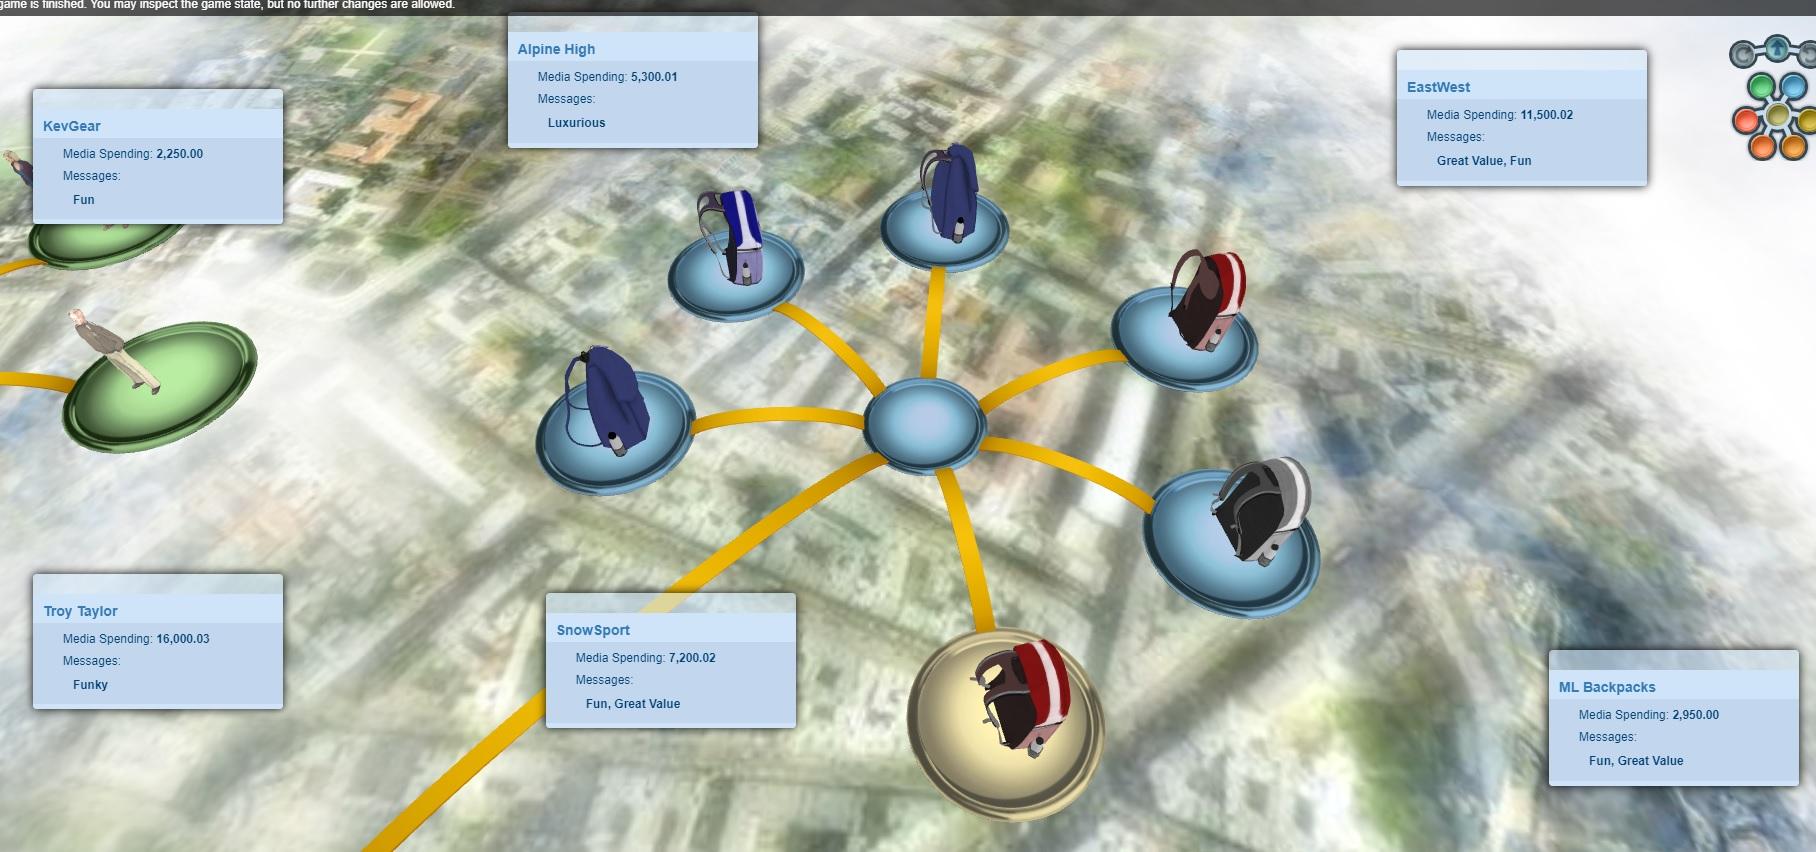
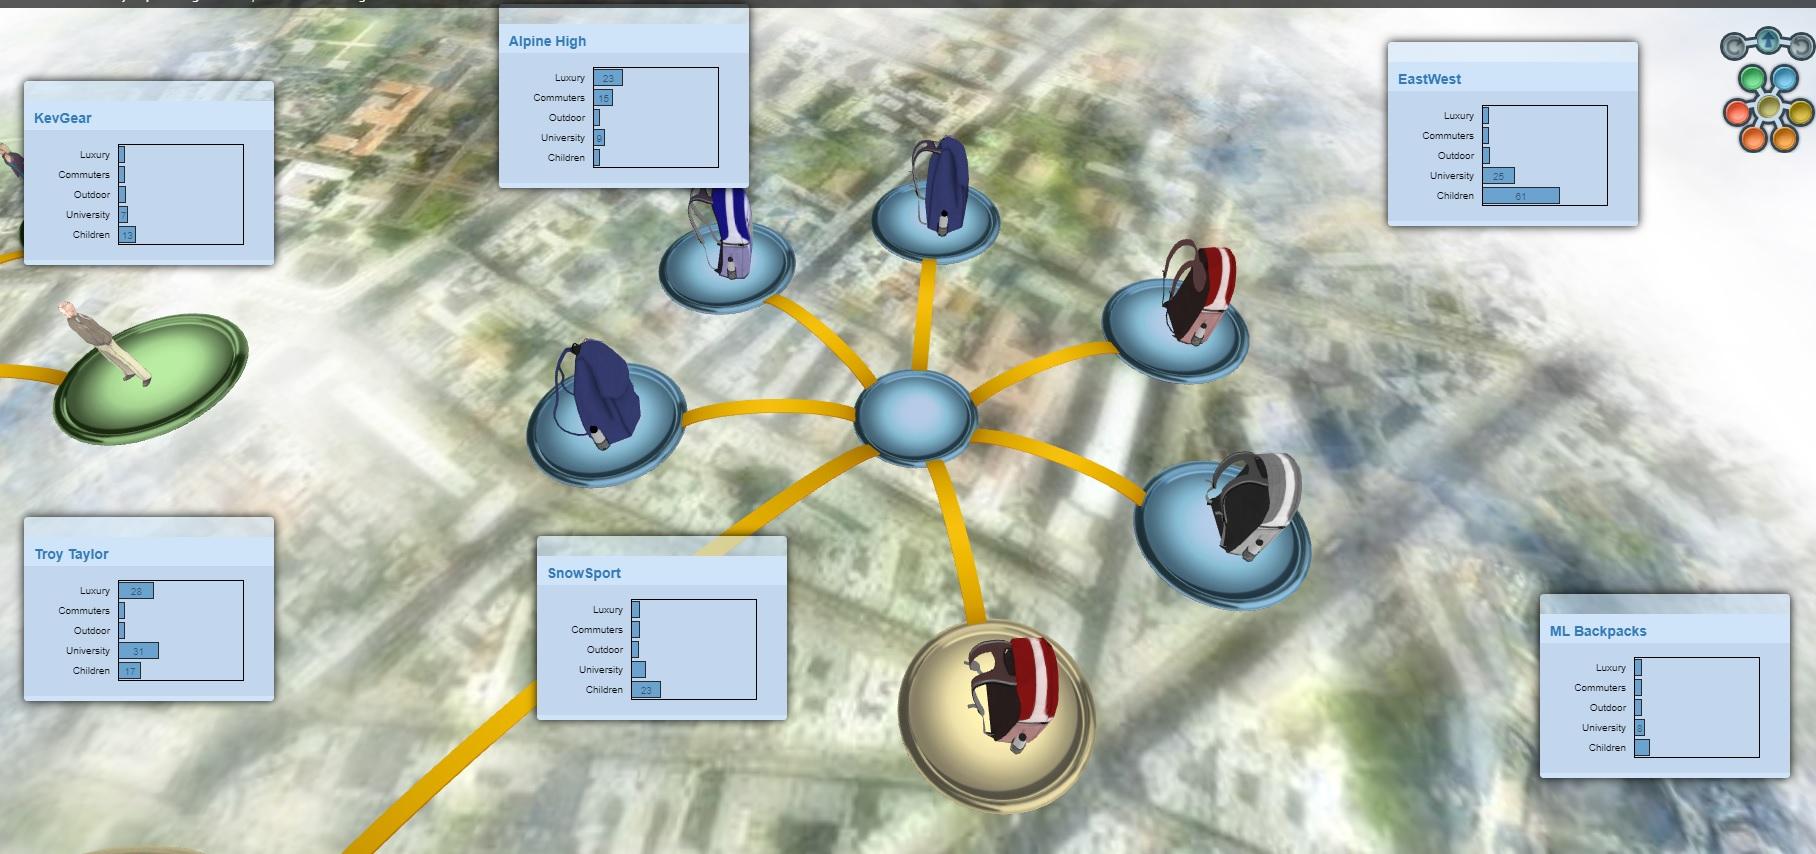
Question: Please Help. PERFORMANCE SUMMARY OF SnowSport Backpack simulation reflection paper- Marketing LAST QUARTER CUMULATIVE LEADER BOARD Cumulative CompanyMLBackpacksSnowSportEastWestAlpineHighKevGearTroyTaylorAccountBalance25,447.808,977.4136,040.053,100.832,896.7444,767.54NetProfit35,447.801,022.5926,040.056,899.177,103.2654,767.54MarketShare9%16%27%22%13%12%UnitsSold3,5186,39216,3494,9677,2254,188ReturnonMarketing90%2%42%8%23%50%CustomerSatisfaction29%34%40%26%31%26%Revenue109,222.70184,247.93313,113.10253,618.35154,346.25141,560.55Satisfaction43%48%51%35%44%35%Score145810051449 QUARTERLY YEARLY TRENDS POSITION MAP ALERTS

Please Help. PERFORMANCE SUMMARY OF " SnowSport" Backpack simulation reflection paper- Marketing

Please Help. PERFORMANCE SUMMARY OF " SnowSport"Please Help. PERFORMANCE SUMMARY OF " SnowSport"Please Help. PERFORMANCE SUMMARY OF " SnowSport"Please Help. PERFORMANCE SUMMARY OF " SnowSport"Please Help. PERFORMANCE SUMMARY OF " SnowSport"Please Help. PERFORMANCE SUMMARY OF " SnowSport"Please Help. PERFORMANCE SUMMARY OF " SnowSport"

LAST QUARTER CUMULATIVE LEADER BOARD Cumulative CompanyMLBackpacksSnowSportEastWestAlpineHighKevGearTroyTaylorAccountBalance25,447.808,977.4136,040.053,100.832,896.7444,767.54NetProfit35,447.801,022.5926,040.056,899.177,103.2654,767.54MarketShare9%16%27%22%13%12%UnitsSold3,5186,39216,3494,9677,2254,188ReturnonMarketing90%2%42%8%23%50%CustomerSatisfaction29%34%40%26%31%26%Revenue109,222.70184,247.93313,113.10253,618.35154,346.25141,560.55Satisfaction43%48%51%35%44%35%Score145810051449 QUARTERLY YEARLY TRENDS POSITION MAP ALERTS EVENTS Quarterly Results 2nd Quarter, 2025 Sales and financial results for the latest quarter Income 1st Quarter, 2025 2nd Quarter, 2025 Change Total Sales: MSRP: 913 194(21%) Total Revenue: 24,660.50 29,721.60 0(0%) Cost of goods sold: Gross profit: Gross margin: 29% 29% 0%(1%) Variable Expenses Marketing Costs: Distribution Costs: 0.00 4,500.00 Total Variable Expenses: Net Profit: Contribution Margin: Overall Market Share: 2,813.508.0115%7,488.831,488.587.8515%8,977.411,324(47%)0(2%)0%(0%)1,488(19%) Bank Balance: QUARTERLY YEARLY TRENDS POSITION MAP ALERTS EVENTS Yearly Results Projected Year: 2025 Sales and financial results for the current year Income Total Sales: Average MSRP: 2025 Projected 2025 Projected Change Total Revenue: 54,382.10 108,764.20 54,382.10(100%) Cost of goods sold: Gross profit: 18,002.10 Gross margin: 29% 29% 0%(0%) Variable Expenses Marketing Costs: Distribution Costs: 0.00 11,700.02 23,400.04 38,380.00(100%) Total Variable Expenses: 4,302.08 8,604.164,302.08(100%) Net Profit: Contribution Margin: 15.86 31.72 15.86(100%) Overall Market Share: 15% 15% 0%(0%)

Step by Step Solution

There are 3 Steps involved in it

1 Expert Approved Answer
Step: 1 Unlock blur-text-image
Question Has Been Solved by an Expert!

Get step-by-step solutions from verified subject matter experts

Step: 2 Unlock
Step: 3 Unlock

Students Have Also Explored These Related General Management Questions!