

Question: ***PLEASE HELP!!!*** PLEASE PLEASE PLEASE INCLUDE EXCEL FORMULAS/FUNCTIONS FOR EACH THANK YOU!!!! 1. A business school has a goal that the average number of years


***PLEASE HELP!!!*** PLEASE PLEASE PLEASE INCLUDE EXCEL FORMULAS/FUNCTIONS FOR EACH THANK YOU!!!!
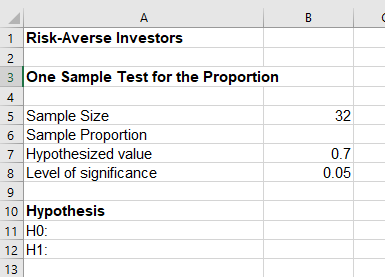
1. A business school has a goal that the average number of years of work experience of its MBA applicants is more than 3 years. Historical data suggest that the variance has been constant at around 6 months and thus, the population variant can be assumed to be known. Based on last year's applicants, it was found that among a sample of 47, the average number of years of work experience is 3.1. Can the school state empathetically that it is meeting its goal? Formulate the appropriate hypothesis test and conduct the test.
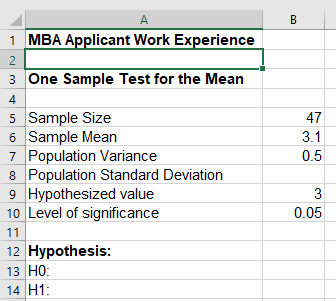
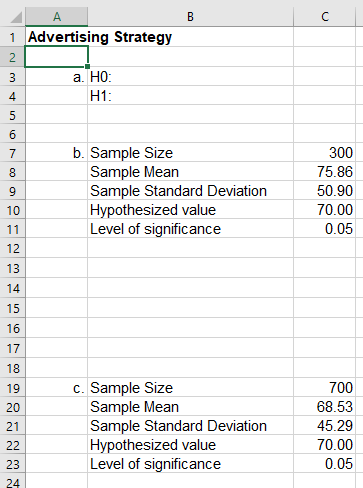


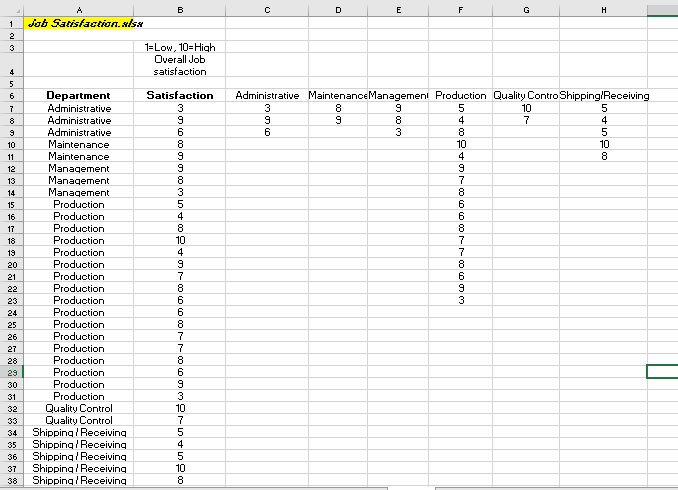
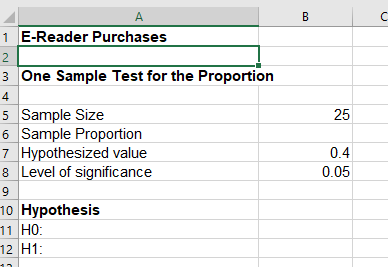
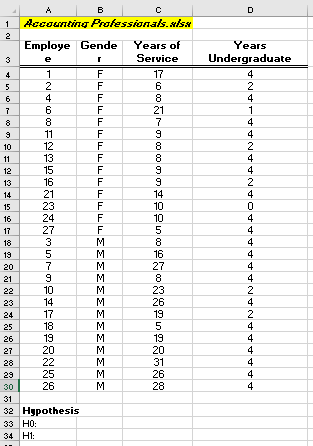
A CO 1 MBA Applicant Work Experience 2 3 One Sample Test for the Mean 4 5 Sample Size 47 6 Sample Mean 3.1 7 Population Variance 0.5 8 Population Standard Deviation 9 Hypothesized value 10 Level of significance 0.05 11 12 Hypothesis: 13 HO: 14 H1:A B C 1 Advertising Strategy 2 3 a. HO: 4 H1: 5 b. Sample Size 300 8 Sample Mean 75.86 9 Sample Standard Deviation 50.90 10 Hypothesized value 70.00 11 Level of significance 0.05 12 13 14 15 16 17 18 19 c. Sample Size 700 20 Sample Mean 68.53 21 Sample Standard Deviation 45.29 22 Hypothesized value 70.00 23 Level of significance 0.05A 1 Risk-Averse Investors 2 3 One Sample Test for the Proportion 4 5 Sample Size 32 6 Sample Proportion 7 Hypothesized value 0.7 8 Level of significance 0.05 9 10 Hypothesis 11 HO: 12 H1: 13A C 1 E-Reader Purchases 2 3 One Sample Test for the Proportion A 5 Sample Size 25 6 Sample Proportion 7 Hypothesized value 0.4 8 Level of significance 0.05 9 10 Hypothesis 11 HO: 12 H1:B C Accounting Professionals. alsa 2 Employe Gende Years of Years e = Service Undergraduate 17 -J a 12 11 13 12 15 13 16 14 21 15 23 10 16 24 17 27 18 19 16 20 27 21 8 22 10 23 23 14 26 24 17 19 25 18 MY 5 26 19 M 19 27 20 20 28 22 M 31 23 25 M 26 30 26 28 31 32 Hypothesis 33 HO 34 H1:H A B C E F G job Satisfaction. alsa 1=Low. 10=High Overall Job satisfaction Department Satisfaction Administrative MaintenanceManagement Production Quality Contro Shipping/Receiving Administrative 3 10 -J Administrative 9 Administrative 10 Maintenance 8 11 Maintenance 12 Management 13 Management 14 Management 15 Production 16 Production 17 Production 18 Production 13 Production 20 Production 21 Production 22 Production 23 Production 24 Production 25 Production 26 Production 27 Production 28 Production 23 Production 30 Production 31 Production 32 Quality Control 33 Quality Control 34 Shipping / Receiving 35 Shipping / Receiving 36 Shipping / Receiving 37 Shipping / Receiving 38 Shipping / Receiving
Step by Step Solution
There are 3 Steps involved in it

Get step-by-step solutions from verified subject matter experts