

Question: PLEASE HELP Problem B.18 For each of the problems B.18.a to B.18.c, plot the function for the specified domain using Microsoft Excel (do not plot
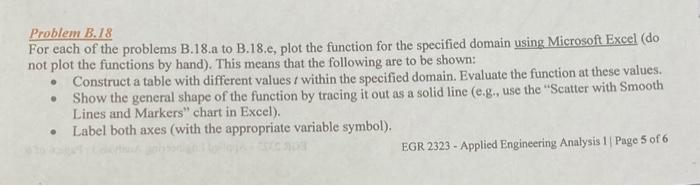
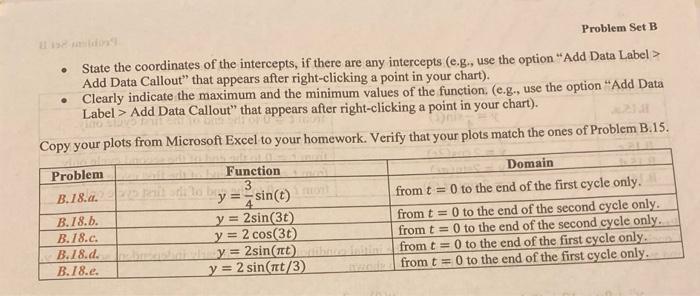
Problem B.18 For each of the problems B.18.a to B.18.c, plot the function for the specified domain using Microsoft Excel (do not plot the functions by hand). This means that the following are to be shown: Construct a table with different values within the specified domain. Evaluate the function at these values. Show the general shape of the function by tracing it out as a solid line (e.g., use the "Scatter with Smooth Lines and Markers" chart in Excel). Label both axes (with the appropriate variable symbol). EGR 2323 . Applied Engineering Analysis 1 Page 5 of 6 . Problem Set B . State the coordinates of the intercepts, if there are any intercepts (e.g., use the option "Add Data Label> Add Data Callout" that appears after right-clicking a point in your chart). Clearly indicate the maximum and the minimum values of the function (e.g., use the option "Add Data Label > Add Data Callout" that appears after right-clicking a point in your chart). Copy your plots from Microsoft Excel to your homework. Verify that your plots match the ones of Problem B.15. Problem Function Domain 3 B.18.a. y = sin(1) from t = 0 to the end of the first cycle only. B.18.b. y = 2sin (30) from t = 0 to the end of the second cycle only. B./8.c. y = 2 cos(30) from t = 0 to the end of the second cycle only. B.18.d. y = 2sin(at) from t = 0 to the end of the first cycle only. B./8.e. y = 2 sin(tt/3) from t = 0 to the end of the first cycle only
Step by Step Solution
There are 3 Steps involved in it

Get step-by-step solutions from verified subject matter experts