

Question: Please help! Quantitative Problem: Rosnan Industries' 2019 and 2018 balance sheets and income statements are shown below. Balance Sheets: 2019 2018 $100 275 $85 300
Please help!
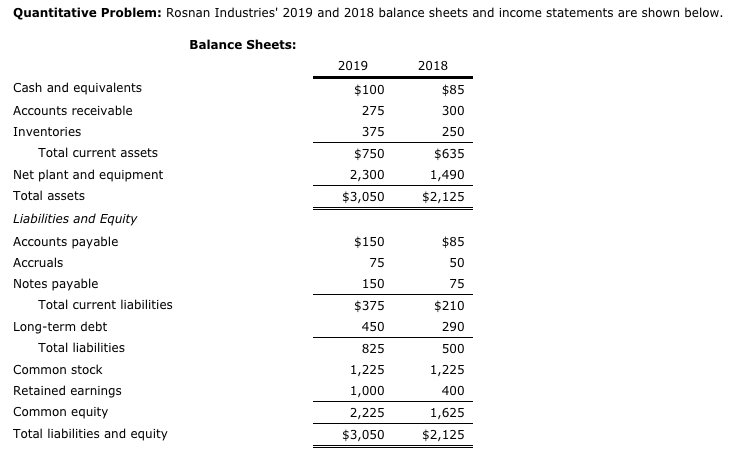
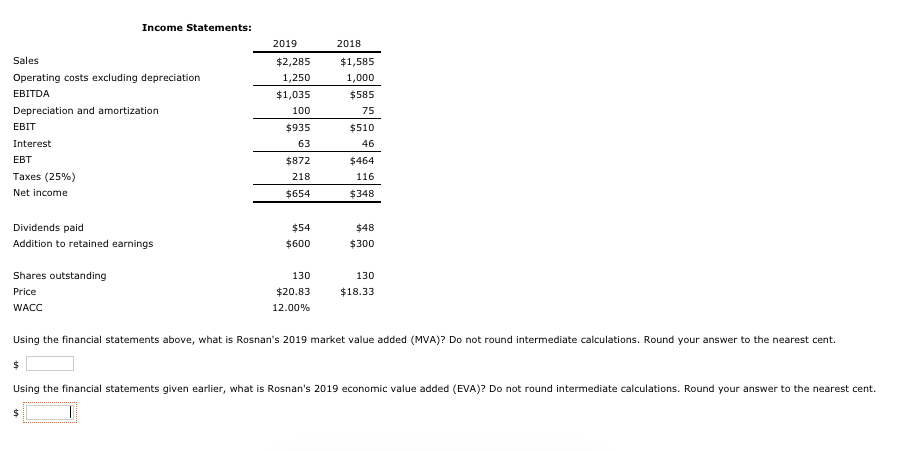
Quantitative Problem: Rosnan Industries' 2019 and 2018 balance sheets and income statements are shown below. Balance Sheets: 2019 2018 $100 275 $85 300 250 375 $750 2,300 $3,050 $635 1,490 $2,125 Cash and equivalents Accounts receivable Inventories Total current assets Net plant and equipment Total assets Liabilities and Equity Accounts payable Accruals Notes payable Total current liabilities Long-term debt Total liabilities Common stock Retained earnings Common equity Total liabilities and equity $150 75 $85 50 150 75 $375 450 $210 290 500 825 1,225 1,000 2,225 $3,050 1,225 400 1,625 $2,125 Income Statements: 2019 2018 Sales Operating costs excluding depreciation EBITDA Depreciation and amortization EBIT $1,585 1,000 $585 $2,285 1,250 $1,035 100 $935 63 75 $510 46 $464 Interest EBT Taxes (25%) Net income $872 218 116 $654 $348 Dividends paid Addition to retained earnings $54 $600 $48 $300 Shares outstanding Price WACC 130 $20.83 12.00% 130 $18.33 Using the financial statements above, what is Rosnan's 2019 market value added (MVA)? Do not round intermediate calculations. Round your answer to the nearest cent. $ Using the financial statements given earlier, what is Rosnan's 2019 economic value added (EVA)? Do not round intermediate calculations. Round your answer to the nearest cent. $
Step by Step Solution
There are 3 Steps involved in it

Get step-by-step solutions from verified subject matter experts