

Question: Please Help!!!! Question 11 3 pts The CPI graph shows the actual CPI values over time up to the current status date. Select the likely
Please Help!!!!
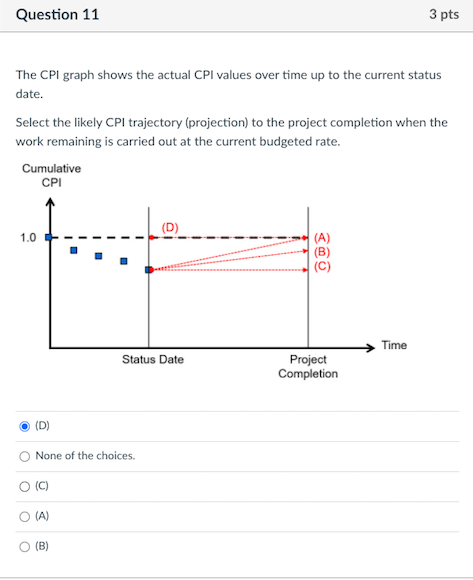
Question 11 3 pts The CPI graph shows the actual CPI values over time up to the current status date. Select the likely CPI trajectory (projection) to the project completion when the work remaining is carried out at the current budgeted rate. Cumulative CPI 1.0 (A) (B) (C) Time Status Date Project Completion (D) None of the choices. (A) (B)Step by Step Solution
There are 3 Steps involved in it
1 Expert Approved Answer
Step: 1 Unlock

Question Has Been Solved by an Expert!
Get step-by-step solutions from verified subject matter experts
Step: 2 Unlock
Step: 3 Unlock