

Question: please help Question 13 The histogram below shows the miles that students commute to a community college. 14 12- 10- 8 N 20 30 40
please help
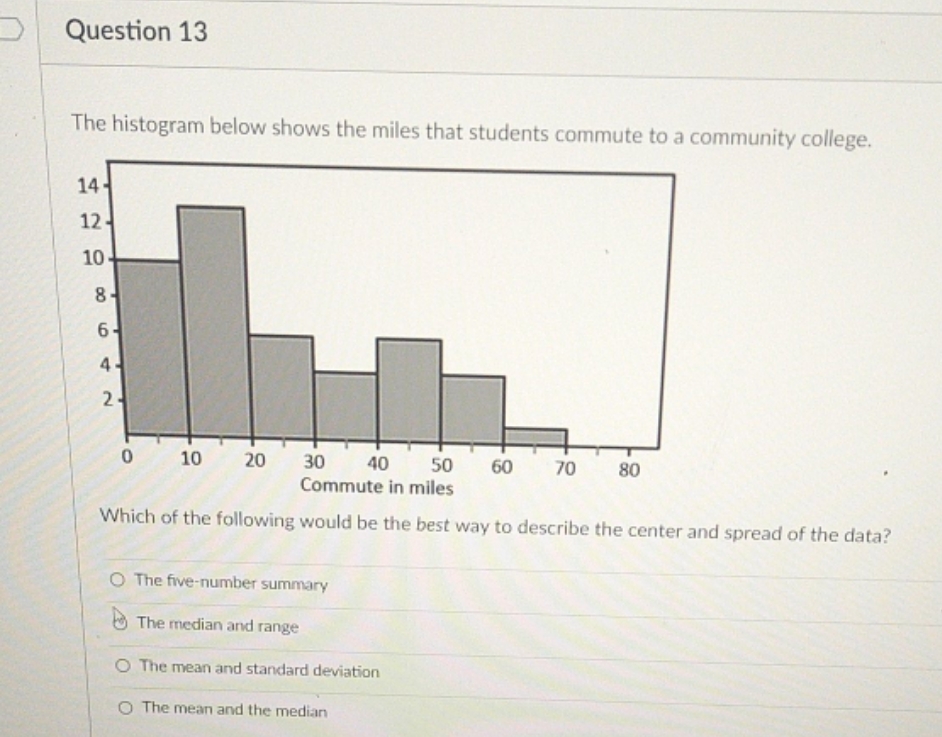
Question 13 The histogram below shows the miles that students commute to a community college. 14 12- 10- 8 N 20 30 40 50 60 70 80 Commute in miles Which of the following would be the best way to describe the center and spread of the data? O The five-number summary The median and range The mean and standard deviation O The mean and the median
Step by Step Solution
There are 3 Steps involved in it
1 Expert Approved Answer
Step: 1 Unlock

Question Has Been Solved by an Expert!
Get step-by-step solutions from verified subject matter experts
Step: 2 Unlock
Step: 3 Unlock