

Question: please help! Sample data for the arrival delay times (in minutes) of airlines flights is given below. Determine whether they appear to be from a
please help!
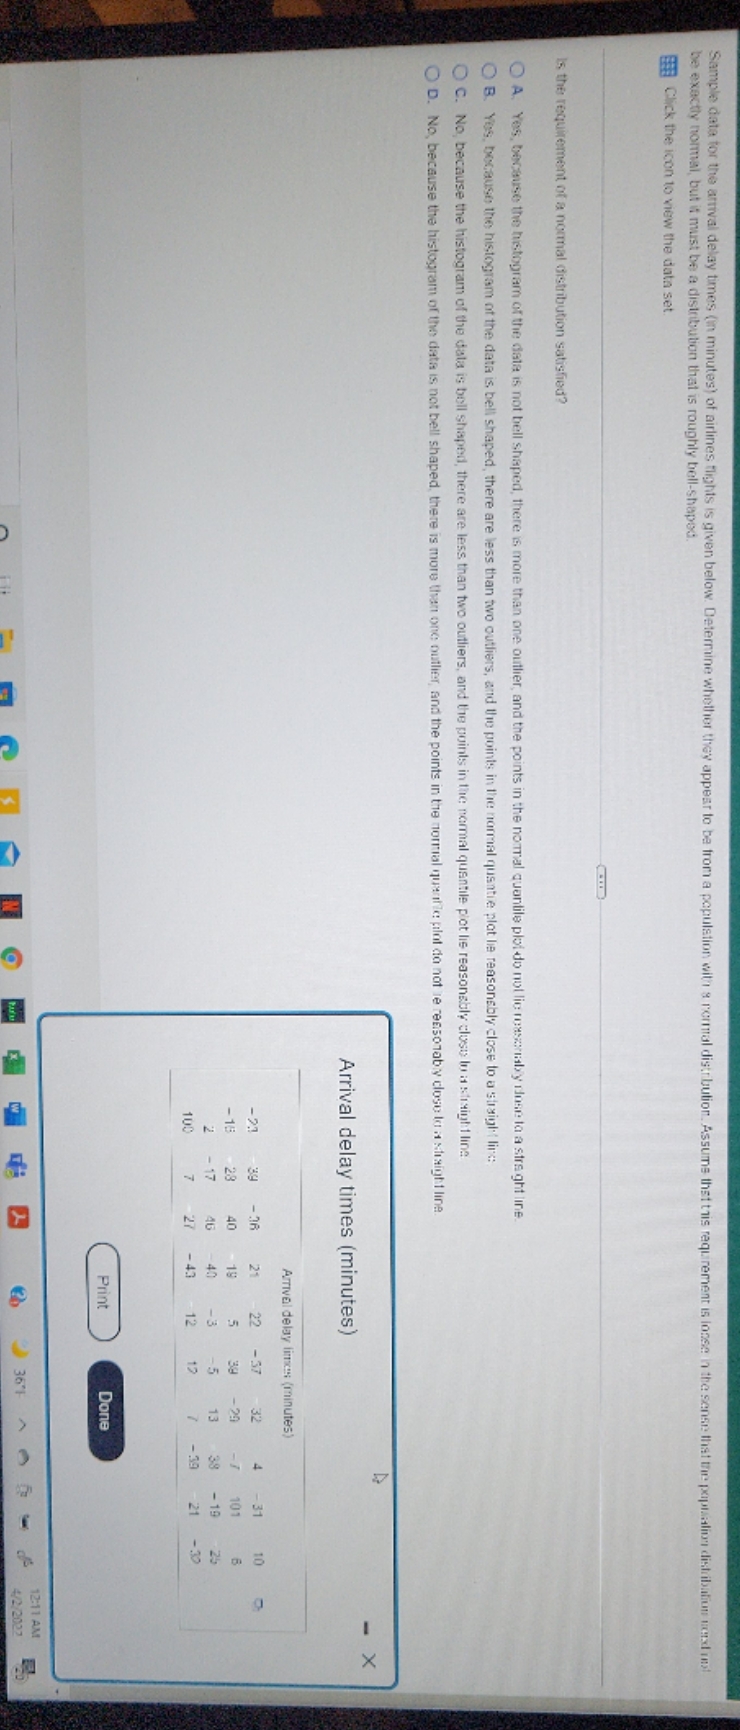
Sample data for the arrival delay times (in minutes) of airlines flights is given below. Determine whether they appear to be from a population with a rental distribution. Assums that this requirement is loose in the sense that the poptalion distribution next inst be exactly normal, but it must be a distribution that is roughly bell-shaped. TH Click the icon to view the data set. Is the requirement of a normal distribution satisfied? O A. Yes, because the histogram of the data is not bell shaped, there is more than one outlier, and the points in the normal quantile plot do not lic reasonably rose to a straight line. O B. Yos, because the histogram of the data is bell shaped, there are less than two outliers, and the points in the normal quantre plot line reasonsbly close to a straight lines O C. No, because the histogram of the data is bell shaped, there are less than two outliers, and the points in the normal quantile plot lis reasonably close In a straight line O D. No, because the histogram of the data is not bell shaped, there is more than one outlier, and the points in the normal quwife plot do not le reasonably close lo a straight line. 4 X Arrival delay times (minutes) Arrival delay lines; (minutes) - 23 39 - 36 N - 37 32 37 2 -16 23 40 19 38 -29 101 in mo 2 17 46 40 -5 13 38 - 19 100 43 12 - 39 21 Print Done 12:11 AM 4/2/2027 20
Step by Step Solution
There are 3 Steps involved in it

Get step-by-step solutions from verified subject matter experts