

Question: PLEASE HELP! SECOND TIME ASKING THIS QUESTION BECAUSE IT WASN'T ANSWERED THE FIRST TIME!! Using this data, enter the data into a new SPSS data
PLEASE HELP! SECOND TIME ASKING THIS QUESTION BECAUSE IT WASN'T ANSWERED THE FIRST TIME!!
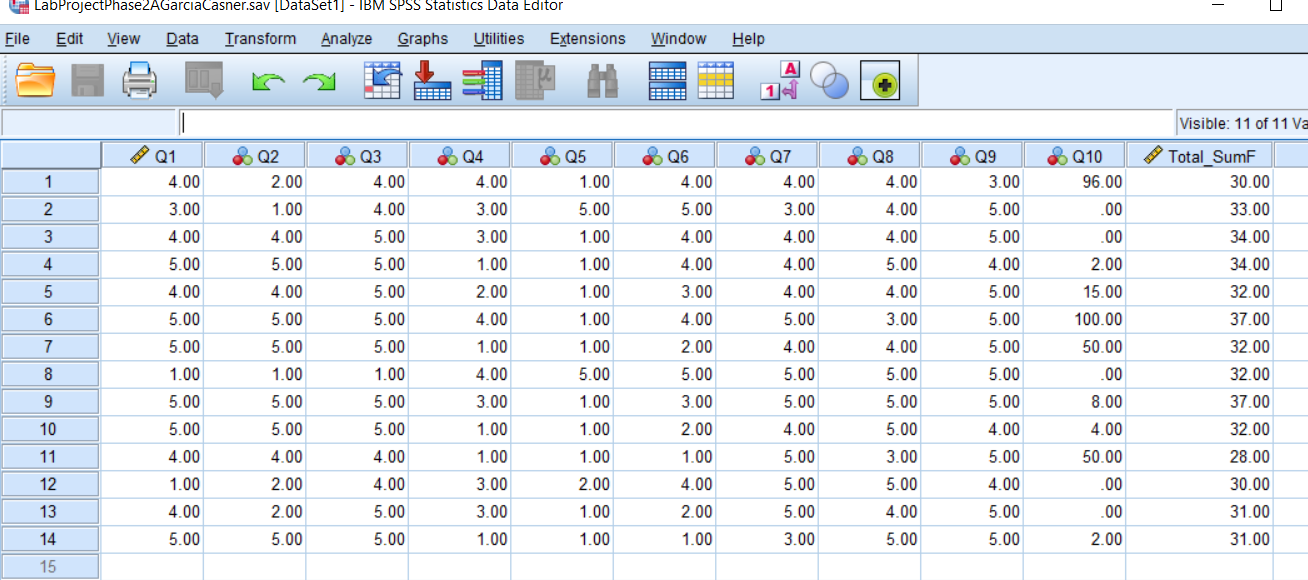
Using this data, enter the data into a new SPSS data file and run a linear regression analysis testing the understanding of the Christian doctrine. A scatter plot with regression line would be a good way to approach this to show any trends with a regression model. I'm attaching my SPSS file which I have already entered the data in. Q1 - Q10 represent the data from the 10 questions answered and each line 1 -14 represents each anonymous person who answered the survey question pertaining to their understanding of Christian doctrine.
Research Question: "Is there a relationship between the frequency of church attendance and the understanding of Christian doctrine?"
\f
Step by Step Solution
There are 3 Steps involved in it

Get step-by-step solutions from verified subject matter experts